NEW TECHNIQUES
What's Your Tradable?
Gopalakrishnan Range Index
by Jayanthi Gopalakrishnan
Should you be trading pork bellies or AT&T? How can you tell what you should be trading, besides painful experience? This might give you a clue.
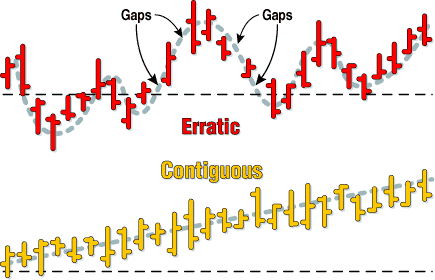
Anyone who has ever observed the markets over time can tell you that some markets are erratic, while some are consistent and contiguous (Figure 1). Both types provide opportunities for trading, but the market you choose to trade will depend on your level of expertise -- some markets are notoriously volatile and not easy to deal with -- and personality. Perhaps you prefer trading in a market that moves consistently regardless of your level of experience, or perhaps you prefer to aggressively move in and out of a market where prices fluctuate wildly. Whatever your preferences, you still need to identify those markets that are most conducive to your trading style. With that in mind, I developed a range index (GAPO for short) to differentiate between market personalities and then used it to rank securities based on their variability.

FIGURE 1: ERRATIC AND SMOOTH MARKETS. Some markets behave erratically. Others are more consistent, with small price fluctuations and overlapping price bars.
It's true that there's always room to negotiate; some security prices that
generally move consistently will have days of erratic behavior, while those
that generally move erratically will have unexpected periods of predictable
trends. The objective of this index is not to generate buy or sell signals,
but to provide an overall picture -- a starting point that you can use
to identify tradables that match your trading style.
The difference between a chaotic market and one that shows less erratic behavior can be seen in the charts displayed in Figures 2 and 3. The pork belly contracts show more erratic price movements than the crude oil contracts do. The pork belly contracts evince more gaps and the percentage price swings are higher than the crude oil contracts.
Traders have been interested in making sense of chaotic markets since the 1960s, when Benoit Mandelbrot analyzed cotton prices. Interestingly, as James Gleick noted, Mandelbrot recognized that there is unexpected order within what appears to be disorder. Based on Mandelbrot's work, I created the GAPO index to measure the dynamic character of the financial markets.
Jayanthi Gopalakrishnan is Technical Editorfor STOCKS & COMMODITIES.
Excerpted from an article originally published in the January 2001 issue of Technical Analysis of STOCKS & COMMODITIES magazine. All rights reserved. © Copyright 2000, Technical Analysis, Inc.
Return to January 2001 Contents