CLASSIC TECHNIQUES
Fibonacci Ratios Still Work To Measure Retracement Of Stock Movement
The Gartley Setup
by Rudy Teseo
If identifying head-and-shoulders or cup-with-handle patterns has left you frustrated, don't despair! This classic system might be for you.
Price patterns by themselves (without moving averages and indicators) are all that is necessary to chart a stock and understand what's happening. We might say that pattern recognition is the heart of technical analysis. If that's true, why are technical indicators the backbone of 99% of our systems? Is it because we have trouble identifying those head and shoulders, cups with handles, and ascending triangles? Here's a technique that uses price charts only, is fairly easy to master, and has a track record of 70% wins.

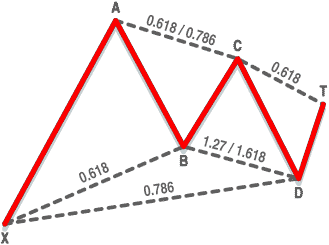
FIGURE 1: BULLISH BARTLEY MODEL. Gartley's model from his 1935 book uses a series of Fibonacci ratios to establish a stock trading in a predictable pattern.
I use Fibonacci ratios to measure the retracements of a stock's up and
down movement, with the objective of developing a geometric pattern that,
when completed, gives a buy or a sell signal.
The sequence of the Fibonacci numbers is zero, 1, 1, 2, 3, 5, 8, 13, 21, 34, 55, 89, 144, 233, 377 ... to infinity. Starting with zero and adding 1 begins the series. The calculation takes the sum of the two numbers and adds it to the following number.
If you take the ratio of two successive numbers in the series by dividing the former by the latter, you find the ratio settles down to a constant value, which is 0.61804. This is called the golden ratio or golden number. If we reverse the procedure and divide the latter by the former, we get 1.61804. These numbers are reciprocals. These two numbers plus their square roots, which are 0.786 and 1.27, respectively, are the only Fibonacci ratios I use.
CHART PATTERNS
Now for some pictures to save a lot of words. The Gartley model was first identified and named by H.M. Gartley in his 1935 work Profits In The Stock Market. It shows a series of price reversals and the retracement percentages that establish an ideal pattern. This is the pattern I want to show you.
Figure 1 shows an uptrend XA with a price reversal at A. Using Fibonacci ratios, the retracement AB should be 61.8% of the price range A minus X, as shown along line XB.
At B, the price reverses again. Ideally, the retracement BC should be between 61.8% and 78.6% of the AB price range, not the length of the lines, and is shown along the line AC. At C, the price again reverses (harmonics at work!). In this pattern, again using Fibonacci ratios, the retracement CD should be between 127% and 161.8% of the range BC and is shown along the line BD. Price D is the trigger to buy. The target retracement DT is initially 61.8% of the range CD; however, the price could go through the roof.
The overall retracement XD is a critical part of forecasting, and is the retracement of the range AD with respect to XA. XD should ideally be 78.6% of the range XA. One further ideal is for CD to equal AB.
I have used ideal to stress the fact that there is no single absolute value for any retracement, nor is there a specific tolerance that tells you this developing pattern is a go or no-go.
Rudy Teseo is a retired communications and computer consultant. He has also taught courses in investing, technical analysis, and options trading. He may be reached via e-mail at rftess@juno.com.
Excerpted from an article originally published in the January 2001 issue of Technical Analysis of STOCKS & COMMODITIES magazine. All rights reserved. © Copyright 2000, Technical Analysis, Inc.
Return to January 2001 Contents