BASIC TECHNIQUES
Why Do Divergences Need To Be Confirmed By Price?
Momentum And Divergence
by Martin J. Pring
Trading momentum requires several levels of perception. Take a look at its divergence with price.
It is a fact that the term momentum is a generic one encompassing all oscillators. It is also a fact that there are many interpretive principles, most of which are common to all momentum series in one way or another. Divergence from price action is a key principle.

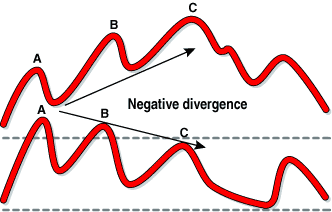
FIGURE 1: LEADING INDICATOR. Since momentum looks at price differences, it's possible for it to lead actual price action.
When using momentum with the overbought/oversold concept, I assumed that
the price and momentum peaked and troughed more or less simultaneously.
That is not often the case. Equally likely is the possibility that the
oscillator will turn ahead of the price. In this instance, the momentum
indicator graphically measures the acceleration or deceleration of a price
move.
In Figure 1, the momentum series peaks at point A, but the price does not peak until C. This conflict between momentum and price is known as a divergence. The example in Figure 1 is referred to as a negative divergence because rising prices are supported by progressively weakening underlying momentum. As in most things in life, it takes much longer to build something than to tear it down, and markets are no exception. I find that momentum divergences at market peaks are far more plentiful and the lead times generally greater than at market bottoms.
Even so, divergences do occur at market bottoms, where they are referred to as positive divergences. Figure 2 shows an example. You can see that the price made its low at point C, whereas the oscillator made its bottom at point A. In this example, the oscillator is said to be walking uphill.
NOTA BENE
Although they indicate a deteriorating or improving market condition, divergences in and of themselves do not signal that the prevailing trend has reversed. That can only come from some kind of trend reversal signal generated by the price itself. This could take the form of a price pattern completion or a moving average crossover, as well as other signals. In this sense, technicians say the divergence has been confirmed by the price.
...Continued in the March 2001 issue of Technical Analysis of STOCKS & COMMODITIES
Martin J. Pring founded the International Institute for Economic Research in 1981. He pioneered the introduction of videos as an educational tool for technical analysis in 1987 and was the first to introduce educational interactive CDs in this field. His website is www.Pring.com, and he may be reached at info@Pring.com.
Excerpted from an article originally published in the March 2001 issue of Technical Analysis of STOCKS & COMMODITIES magazine. All rights reserved. © Copyright 2001, Technical Analysis, Inc.
Return to March 2001 Contents