![]()
![]()
IES-INVEST.COM
Covered-call investing is probably the most conservative of all options techniques. Many investors use this technique to hedge their stock holdings. However, finding good covered calls can be a complicated task.
When identifying good covered calls, it's necessary to select those with a high premium (out-of-the-money). Investment Enhancing Systems, Inc., is offering a program on the web that not only identifies the best covered calls but also tells you how many shares you can purchase with the money you have available, provides the stock and call symbols, and determines annualized returns if the stock is called or if stock price remains the same at expiration. Although the company has been providing this service since 1998, it has only recently started offering it through the web.
The different sections included in this site are:
- Short course
- Try Analyzer
- Analyzer results
- Find-a-stock
- Find-a-stock results
The short course is an educational segment introducing you to the fundamentals of option trading, with an emphasis on covered calls. The Analyzer simplifies the task of finding high-return covered calls. It identifies good stock/call combinations by selecting those that have a strike price above the purchase price (out-of-the-money call).
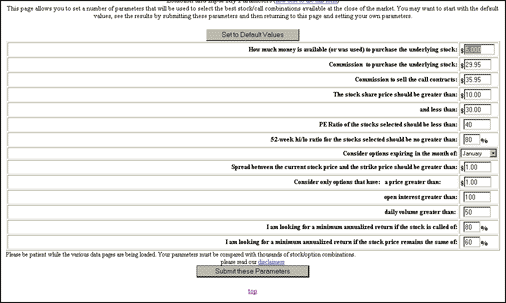
To get results, you first need to input and submit your parameters. Then the Analyzer will find all stock/call combinations that meet your input parameters, have a high premium price, and have a large spread between the purchase price and out-of-the money strike price.
The input parameters include:
1 Amount of money available (or used) to purchase the underlying stock
2 Commissions
3 Stock price range
4 52-week high/low ratio
5 Expiration month
6 Spread between current stock price and strike price
7 Option price range
8 Open interest
9 Daily volume
10 Annualized returns demanded.A display of the input parameters can be seen in Figure 1.

FIGURE 1: INPUT PARAMETERS. You need to enter several input parameters before the program can identify the best stock/call combinations specific to your needs.
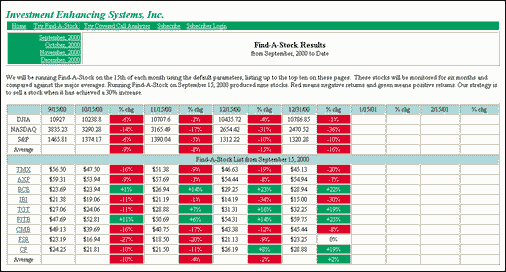
You can also screen stocks based on minimum and maximum stock price, minimum P/E ratios, maximum 52-week high/low ratio, minimum earnings estimates for the following year, minimum volume, minimum beta, and minimum annualized yield.Besides the screening tool, there is a "stocks-to-consider" section that is updated after the third Friday of each month (expiration day). It displays a list of the top 10 stock/call combinations. A click on any of the symbols will take you to the Yahoo! Finance page of that specific stock, where you can do all your analysis. A summary of the results of this feature can also be found on the site (Figure 2).

FIGURE 2: FIND-A-STOCK RESULTS. The results are available on the website so you can get an idea of the success rate of the program.
In addition, you can enter symbols to receive stock and option quotes. A short section of comments about the current market conditions can be found on the home page.All these services are available free for the first 30 days and $19.95 per month thereafter. Not a bad price, considering that screening the best stock/call combinations is an involved task. After all, who wouldn't want to identify the few stocks that have the potential to give you the returns you are looking for?
--Jayanthi Gopalakrishnan,
Technical Editor
STOCKCHARTS.COM/CHARTS/CARPET.HTML
StockCharts, a Redmond, WA-based company founded by former Microsoft veteran Chip Anderson, provides a clever tool for market and sector analysis. StockCharts uses a technique called Market Carpet (Figure 1). It's not exactly a carpet, though; it's more of a quilt. Regardless of description, the carpet presents a wealth of information on a single screen.

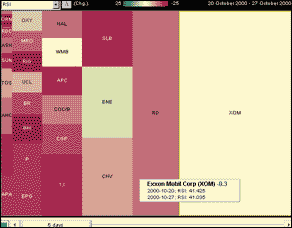
FIGURE 1: STOCKCHARTS MARKET CARPET. S&P sectors using RSI with a six-day period from October 20 through October 27.
Are you tired of trying to find a mutual fund that fits the right sector? Are you tired of trying to find the right sector? Well, the Market Carpet might be the right choice for you. StockCharts uses the following ground rules: (1) define sectors based on AMEX unit investment trusts; (2) only use indicators that are relative measures so comparisons can be made; (3) color-code the results for quick interpretation; (4) identify who are the five highest and five lowest performers, according to indicator chosen; and (5) provide user control over the periods to be analyzed and when the analysis is to start.You can choose from four different carpets. The Standard & Poor's Sector Carpet consists of the AMES sector SPDRs (on the StockChart home page, search the site using "spdr," then click on the sector of your choice and see a list of the individual stocks via the Nasdaq site). The Market Summary Carpet consists of the Dow Jones Industrial Average (DJIA), the Nasdaq Composite, the Russell 2000, and many others. The Major Averages Carpet covers the DJIA, Dow transports, Dow utilities, and the Nasdaq 100. A Fidelity Fund Carpet covers growth and selected portfolios.
When you first see a market carpet (Figure 1), it may at first appear overwhelming, but after a few minutes of use, it will just whet your appetite for more. You can choose from seven different indicators. StockCharts explains each indicator and gives an example of its use. Each square is one company. For the indicator chosen, a number from -5 (worst indicator value) to +5 (best indicator value) is on one of the squares.
The top of the carpet screen shows the extremes in indicator value (Figure 1: colored bar going from +25 to -25 at the top of the chart for relative strength index, or RSI). I can look at indicator changes (Figure 1: small triangle in upper left), as opposed to absolute values of the indicator. For indicator parameter changes, I control the number of days by clicking and dragging either the left- or right-hand edges of a slider (Figure 1: rectangle at bottom with "6" in it) and the starting date by moving the slider along the line at the bottom of the chart. Clicking on a square shows the company and the indicator values.
You can select the individual stock symbols (Figure 2) instead of seeing the five highest or five lowest by indicator choice. You can also see companies by market capitalization, and when you move the slider at the bottom, you can watch the colors change as the dates change. You can also customize the colors. Each indicator measures the stock relative to itself, allowing the carpets to compare stocks to one another. Each indicator has been chosen to be a single number to enable color-coding of a square (or a rectangle using market cap). For example, to show volatility, Bollinger Bands were broken into two pieces: width and position relative to center. Percentage price oscillator (PPO) is used in lieu of moving average convergence/divergence (MACD) to which it is very similar. The data for the charts is updated daily, usually within one hour of market close.

FIGURE 2: STOCKCHARTS S&P ENERGY SECTOR. Options allow the user to see companies as represented by market capitalization and ticker symbol. Clicking on an area gives indicator details.
StockCharts Market Carpet is an innovative approach for identifying sector and market rotation. Give it a try; you may be pleasantly surprised.--Dennis D. Peterson, Staff Writer
Originally published in the March 2001 issue of Technical Analysis of STOCKS & COMMODITIES magazine. All rights reserved. © Copyright 2001, Technical Analysis, Inc.