Tracking Risk Premium
Seasons In Soybeans
by Scott Barrie
Year after year, the Earth turns around its axis, producing trading opportunities you can exploit with technical tools.
Seasonality and technical analysis can be a powerful combination. Traders who understand the natural supply and demand cycles in the commodities markets can anticipate market turns more precisely, helping them isolate good trading situations and avoid poor ones. Here's a practical application: tracking risk premium in the soybean market.

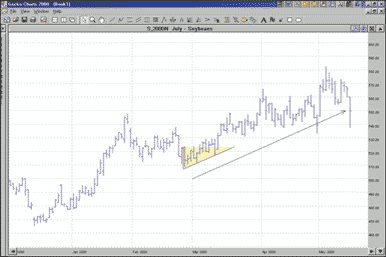
FIGURE 1: JULY 2000 SOYBEAN ACTION. A false breakout below support followed by an upside breakout from an ascending triangle signaled the start of a typical planting rally as the soybean market began to build a risk premium into prices during March and April.
Soybean prices change based on the perception of future supply.
The amount of change is called risk premium. When future supply
is perceived to be limited, futures markets tend to build risk premium
into prices; thus, prices are higher than would be expected based on present
supply and usage patterns. As the perception of future supply becomes clearer,
prices return to a lower level more consistent with supply and usage patterns.
At the beginning of 2000, the grain markets were abuzz with talk of drought and minimal soil moisture levels due to a dry winter. In response, July soybeans uncharacter-istically rallied hard in January (Figure 1), only to be overcome in February by producer selling in a classic February break.
At the end of February, the July 2000 soybean contract broke below support made earlier in the month but quickly reversed to break out above resistance, technically signaling a trend change during a time of year when the soybean market traditionally rallies. A powerful rally followed; the market built risk premium into prices as worry about soil conditions and a possible drought consumed trading activity.
...Continued in the May 2001 issue of Technical Analysis of STOCKS & COMMODITIES
Scott Barrie is president of Commodity Futures and Equity Analytics and author of the 2001 Grain Trader's Almanac. He can be reached at 541 472-1975 or via his website, www.grainguide.com.
Excerpted from an article originally published in the May 2001 issue of Technical Analysis of STOCKS & COMMODITIES magazine. All rights reserved. © Copyright 2001, Technical Analysis, Inc.
Return to May 2001 Contents