NEW TECHNIQUES
Valuing A Stock Using Earnback Periods
Screening For Misvalued Stocks
by Martti Luoma and Reijo Ruuhela
You won't get an edge on finding good trades using the same tools everyone uses. Here's a new look at finding misvalued stocks.
The price/earnings ratio (P/E) is undoubtedly the most common valuation measure of a stock, and also the most commonly misused. P/E combines outside information (price) and inside information (earnings). Because of the central roles that price and earnings play, it is not particularly surprising that the use of P/E is so popular among analysts and investors.

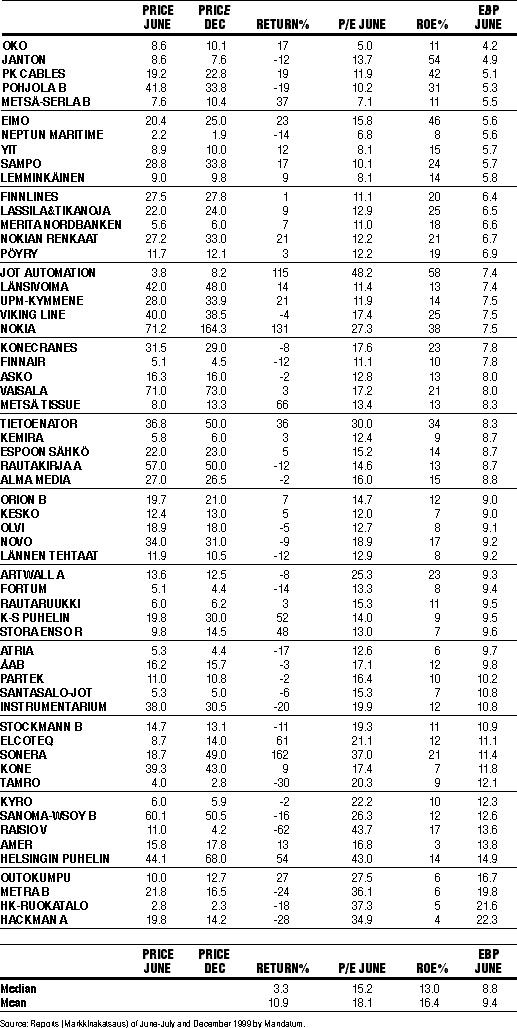
FIGURE 1: EBPs for some stocks in the Helsinki Stock Exchange in June 1999.
It is well known that stocks should have as near to the same growth rate
as possible when they are compared using P/E, because the valuation of
a stock is not a matter of analyzing only a single year's earnings. Unfortunately,
it is often necessary to compare stocks with different growth rates. As
a measure of valuation, however, P/E neglects different growth rates of
earnings. For this, you can use the price-earnings growth factor (PEG),
introduced by Jim Slater in his Investment Made Easy:
![]()
Growth stocks are those with a PEG of less than 0.5 or 0.75 at the most.
But PEG is something of an ad hoc method, and its interpretation purely
empirical. How, then, can we compare different growth rates?
Here's how to modify the P/E ratio to create a measure that can be interpreted clearly, and how the measure can be used to compare stocks with different growth rates. The new measure should help you find undervalued or overvalued shares.
EARNBACK PERIOD
One reason for the P/E's popularity is its oversimplified interpretation of the number of years needed to earn back the price of the stock using earnings of the year in question. For example, if P/E equals 10, theoretically it takes 10 years for a corporation to earn an amount equal to the stock price (P), provided that earnings remain constant (that is, a growth rate of zero).
This interpretation, although logical, is useless because a corporation with a zero growth rate for earnings is an exception. Usually, an investor wants to compare stocks of corporations with different expected growth rates; for example, stocks of different industries. The earnback period (EBP) is the number of years that a corporation with a constant growth rate takes to earn back its share price; the "EBP computation" sidebar shows an equation to determine this. ...Continued in the May 2001 issue of Technical Analysis of STOCKS & COMMODITIES
Martti Luoma is a former professor of statistics for the University of Vaasa, Finland; Reijo Ruuhela is a former professor of accounting for the University of Vaasa.
Excerpted from an article originally published in the May 2001 issue of Technical Analysis of STOCKS & COMMODITIES magazine. All rights reserved. © Copyright 2001, Technical Analysis, Inc.
Return to May 2001 Contents