INDICATORS
For Support And Resistance
Volume-Weighted Average Price
by George Reyna
Here's how to use VWAP with the Midas indicators.
Successful traders know how important it is to evaluate volume before taking a position in the market. This concept has been much discussed, but understanding the relationship of price behavior and volume is usually an intuitive exercise. Long-term success is based on experience level and seasoned judgment. On the other hand, volume-weighted average price (VWAP) calculations can create powerful indicators that graphically represent the interaction between price and volume on one chart. This makes it easier to get a feel for market psychology and spot potential major reversals.

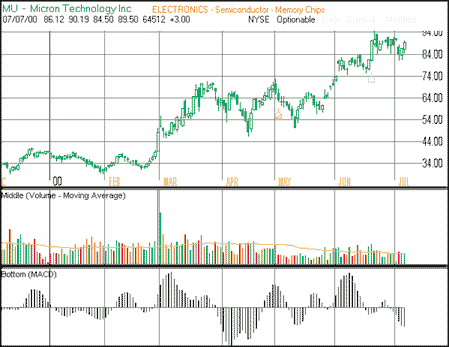
FIGURE 1: MICRON TECHNOLOGY. MU comes down to support at $51.
APPROACHES
There are at least three major approaches to applying VWAP as an indicator
in a trading system. The first two are not easily traded by the average
position trader, but we'll discuss them briefly to put the indicator into
context.
VWAP has been extensively used by the mutual fund and pension fund industries
to measure the performance of individual managers and compare the trading
performance between companies. Essentially, in a long position, if the
trade is lower than the daily VWAP, it is considered a good trade; if the
trade is higher than the daily VWAP, it is a weak trade. On short positions,
the evaluation is reversed.
In his interview with STOCKS & COMMODITIES,
trader Kevin Haggerty discussed another use of VWAP. Haggerty explained
that he looked at whether the stock closed above the VWAP, and the midpoint
of the stock price for the day. He added that he determined where the majority
of volume occurred on the offer or the bid side.
A third approach independently developed by Paul Levine and Stokes Fishburne
involves using VWAP as part of a trading system based on plotting an average
price against cumulative volume instead of the usual method of plotting
closing price against time. A further refinement computes VWAP support
and resistance curves on an average price versus cumulative volume chart.
This idea was developed in the mid-1990s into a "market interpretation/data
analysis system" bundled into a software package known as WinMidas
by developer Stokes Fishburne (see "Related reading" at the end
of this article). Although the product is no longer sold, the application
of this approach is quite useful. Fishburne still sends out copies on a
trial basis (www.rocketdownload.com/Details/Smal/winmidas.htm), but there
is no product support, so users are on their own.
Although I've studied hundreds of charts, I find the ability of this technique
to detect potential significant reversal points uncanny. Before examining
the details of the use of volume-weighted average price and cumulative
volume, let's look at a few formulas to understand the power of VWAP.
...Continued in the May 2001 issue of Technical Analysis of STOCKS & COMMODITIES
George Reyna has a bachelor's degree in engineering and a master's degree in business, and has been a private trader for the past three years. He can be reached via e-mail at g.reyna@home.com.
Excerpted from an article originally published in the May 2001 issue of Technical Analysis of STOCKS & COMMODITIES magazine. All rights reserved. © Copyright 2001, Technical Analysis, Inc.
Return to May 2001 Contents