TRADING TECHNIQUES
The Early Bird Does Get The Worm
Trade The Opening's Reaction
by Perry R. Stevens, MD, MBA
Here's a simple, profitable trade you can make during the opening 30 minutes of the market.
The first 15 to 30 minutes after the stock market opens are usually the most volatile and the trickiest time of the day to make a trade. During this period, traders and investors alike are sizing up the market and eyeing specific stocks to buy or trade and may even take action. Any news that has come out since the market's close of the previous session or prior to the opening has been digested and interpreted. Analysts are upgrading and downgrading, and the talking heads on the financial news shows are also weighing in with their comments. In short, the opening minutes of the market can be volatile, and for this reason, many traders prefer to sit back and wait until a trend develops.

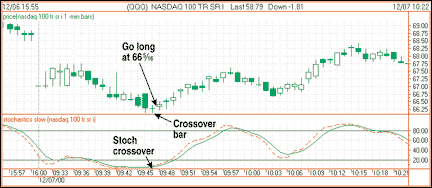
FIGURE 1: LONG. Using a one-minute chart of the QQQ, go long as the quick %K crosses the slow %D upward from extreme levels.
Once the initial intraday trend has emerged, if you choose to enter, you
may be entering late into the day's activity and will be susceptible to
the reaction that commonly occurs as the traders who bought or sold at
the open take their profits. On the other hand, this reaction, or pullback,
offers an opportunity for a reliable, profitable trade using one-minute
bar charts and a 14-period stochastic.
WHAT'S THE METHOD?
For this study, I used the QQQ (Nasdaq 100 Trust), although any liquid stock with a fair degree of intraday volatility may be considered.
The setup is as follows: Once the stock opens, monitor the action using one-minute charts. Expect a fair amount of high-volume, choppy trading in the first 15 minutes as investors and traders get their orders filled.
At 9:45 am ET, begin to look for the "reaction" -- that is, a countermove against the initial opening prices. Once under way, the reaction frequently draws in traders who have been sitting on the sidelines and are now anxious to open a position.
In essence, the trade is a swing that looks for a short-term bottom or top. Now, on the same screen as the one-minute chart (Figures 1 and 2), display a slow stochastics oscillator and wait for the %K and %D to become oversold or overbought. In this study, 80 is considered overbought and 20 is oversold. (Although 70 and 30 can be used, the more extreme values will result in trades with larger profits.) If the stock you are monitoring for the trade rarely reaches the 80 or 20 levels, that stock is probably not a good candidate for this technique.
Once the %D and %K are in the extreme zones, wait for the "quick" line (%K) to cross the "slow" line (%D) in the extreme zone. If the cross occurs below 80 or above 20, pass on the trade. Although a nonextreme cross inside the 20-80 range may be profitable at times, overall it suggests that there is less momentum building. Further, the stop-loss point will be too far away from the entry point. ...Continued in the May 2001 issue of Technical Analysis of STOCKS & COMMODITIES
Perry R. Stevens is a full-time emergency-medicine physician in New York City and an active part-time trader. He also holds an MBA in finance. He can be reached at MDTrader1@aol.com for comments or questions.
Excerpted from an article originally published in the May 2001 issue of Technical Analysis of STOCKS & COMMODITIES magazine. All rights reserved. © Copyright 2001, Technical Analysis, Inc.
Return to May 2001 Contents