CHARTING
A Reversal Pattern
The Folding Rule
by Viktor Likhovidov
How about a simple charting technique to ride the wave and get off in a timely manner?
Here's a reversal pattern I frequently observe on hourly charts of currencies and sometimes use in trading. I call it the folding rule due to its resemblance to the carpenter's tool.
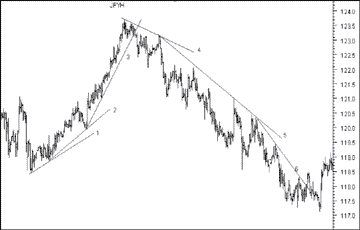
This pattern appears on accelerating markets, as shown in the hourly chart of the yen for March 1999 (Figure 1). Here, trendline 1 (the first ray of the folding rule), drawn through two local minimums as a support line, determines the initial direction of the growing market. But then the steeper upmove started and support line 2 (ray 2) was created. Finally, a new, steeper bullish trend (ray 3) appeared. The breach of the third ray marked the end of the bullish market and gave the sell signal.

FIGURE 1: THREE UP, THREE DOWN, MARCH 1999 YEN. The folding rule captures the wave movement often noted in the market.
The downward movement also accelerated consecutively. After trendline 4 formed, the chart left it for the new bearish trend 5 and the steeper trend 6 (ray 3). The breakout of the third ray meant the end of the bearish trend and gave the buy signal.
The declining folding rule in this example looks like a more balanced pattern; its rays have more substantial lengths and are drawn through three local highs. In addition, the angles between the rays are almost equal. Such a balanced pattern usually gives more reliable signals.
The next example (Figure 2), an hourly chart of the yen in February 2001, prompts one more trading idea related to the folding rule: When the third ray is breached (that is, the whole pattern is confirmed), then the continuation of the first ray (the dashed line) turns out to be a strong consolidation line. The crossing of this line is a trading signal (sell, in this example). The hourly chart of the Swiss franc in January 2001 (Figure 3) also illustrates this idea.
Viktor Likhovidov, a financial analyst and consultant based in Vladivostok, Russia, performs research in the areas of pattern recognition, neural networks, and mathematical methods in currency markets analysis. He may be reached at ltfx@fastmail.vladivostok.ru or lita@math.dvgu.ru
Excerpted from an article originally published in the June 2001 issueof Technical Analysis of STOCKS & COMMODITIES magazine. All rights reserved. © Copyright 2001, Technical Analysis, Inc.
Return to June 2001 Contents