or return to June 2001 Contents
You can copy these formulas and programs for easy use in your spreadsheet
or analysis software. Simply "select" the desired text by highlighting
as you would in any word processing program, then use your standard key
command for copy or choose "copy" from the browser menu. The copied text
can then be "pasted" into any open spreadsheet or other software by selecting
an insertion point and executing a paste command. By toggling back and
forth between an application window and the open Web page, data can be
transferred with ease.
This month's tips include formulas and programs for:
or return to June 2001 Contents
The default value for the price input is set to the close value. This can be edited at the time the indicator is applied to a chart. The user may want to experiment with other values for price, such as MedianPrice. MedianPrice is a built-in function in EasyLanguage that returns (High + Low) / 2.inputs: Price( Close ), VolumeDivisor( 1 ), N( 100000 ) ;variables: eVWMA( 0 ), ScaledVol( 0 ), VolDiff( 0 ), Violation( false ) ;if CurrentBar = 1 then eVWMA = Priceelse begin ScaledVol = Volume / VolumeDivisor ; VolDiff = N - ScaledVol ; if VolDiff < 0 and Violation = false then Violation = true ; if Violation = true then eVWMA = eVWMA[1]else eVWMA = ( VolDiff * eVWMA[1] + ScaledVol * Price ) / N ; end ;Plot1( eVWMA ) ;
If the volume figures on the chart are too large, this can result in overflow errors at runtime. In such a case, the user should scale down the volume by increasing the VolumeDivisor input (the default setting of "1" results in no scaledown).
Finally, the default value for the total volume, N, is set to 100,000. If this turns out to be less than the scaled volume at any bar on the chart, the indicator is designed to plot a flat line from there onward. In such a case, N needs to be increased.
This code will be available for download at TradeStation Technologies' website. Look for the file "ElasticVwma.Els."
--Ramesh Dhingra, Product Manager, EasyLanguageGO BACK
TradeStation Technologies, Inc. (formerly Omega Research, Inc.)
A wholly owned subsidiary of TradeStation Group, Inc.
https://www.TradeStation.com
eVWMA
n := Input("Enter the number of shares: ",1,1000000,1);
eVWMA := ((n-V)*PREV+(V*C))/n;
eVWMA
--Cheryl C. Abram, Equis International, Inc.GO BACK
https://www.equis.com
Standard Deviation BandsGO BACKstdh := Mov(C,20,E)+2*(Stdev(C,20)); stdl := Mov(C,20,E)-2*(Stdev(C,20)); stdh; stdlAverage True Range Bandsstdha := Mov(C,20,E)+2*(ATR(20)); stdla := Mov(C,20,E)-2*(ATR(20)); stdha; stdla--Cheryl C. Abram, Equis International, Inc.
https://www.equis.com

FIGURE 1: NEUROSHELL TRADER. Here's the Power Basic source code for the elastic volume-weighted moving average to create the DDL for the NeuroShell Trader.
We've recreated the elastic volume-weighted moving average (eVWMA)
for NeuroShell Trader and posted it for Standard Deviation Bands download
at the NeuroShell Trader free technical support website. We also provide
the code at the website so that if you want to make any modifications to
it you will be able to do so.
After downloading the custom indicator, you can easily insert it (Figure 2) or combine it with any of our more than 800 built-in indicators into a chart, prediction, or trading strategy.
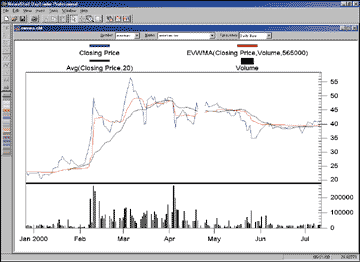
FIGURE 2: NEUROSHELL TRADER. A NeuroShell Trader chart displays the elastic volume-weighted moving average.
Users of NeuroShell Trader can go to the STOCKS & COMMODITIES section of the NeuroShell Trader free technical support website to download a copy of these or past Traders' Tips for NeuroShell Trader.
For more information on NeuroShell Trader, visit www.NeuroShell.com.
--Marge Sherald, Ward Systems Group, Inc.
301 662-7950, sales@wardsystems.com
https://www.neuroshell.com
Note that the true range indicator is included in the NeuroShell Trader Advanced Indicator Set add-on and is also available for free download from the Ward Systems Group free technical support website.Standard Deviation Bands:STDH: Add2(ExpAvg(Close,20), Mult(StndDev(Close,20),2)) STDL: Sub(ExpAvg(Close,20), Mult(StndDev(Close,20),2))Average True Range Bands:STDHA: Add2(ExpAvg(Close,20), Mult(AverageTrueRange(Close),20),2)) STDLA: Sub(ExpAvg(Close,20), Mult(AverageTrueRange(Close),20),2))
To test the standard deviation and average true range indicators in NeuroShell Trader as Gustafson does in the last half of his article, you can create the three trading strategies shown below. Since NeuroShell Trader is not limited to only one trading strategy per chart, you can create and display all three trading strategies on a single chart. To create a trading strategy, select "New Trading Strategy ..." from the Insert menu and enter the entry and exit conditions in the appropriate locations of the Trading Strategy Wizard:
Standard Deviation Band Trading Strategy:Generate a buy long MARKET order if ALL of the following are true: A<B(Close, STDL)Generate a sell long MARKET CLOSE if ALL the following are true: BarsSinceActivated(TradingStrategy,5)Average True Range Trading Strategy:Generate a buy long MARKET order if ALL of the following are true: A<B(Close, STDLA )Generate a sell long MARKET CLOSE if ALL the following are true: BarsSinceActivated(TradingStrategy,5)Exclusive Average True Range Trading Strategy:Generate a buy long MARKET order if ALL of the following are true: A<B(Close, STDLA) A>B(Close, STDL)Generate a sell long MARKET CLOSE if ALL the following are true: BarsSinceActivated(TradingStrategy,5)
If you own NeuroShell Trader Professional, you can also choose whether
or not the system parameters should be optimized. To set up the trading
strategy to trade a fixed $510,000 of S&P contracts, simply press the
"Modify Trading Strategy Parameters ..." button, choose the "Buy a fixed
dollar amount of contracts" option, set the desired dollar amount to $510,000,
and then set the point value for futures contracts to 250. After backtesting
each trading strategy, use the "Detailed Analysis ..." button to view the
backtest and trade-by-trade statistics for the system.
Users of NeuroShell Trader can go to the STOCKS & COMMODITIES section of the NeuroShell Trader free technical support website to download a sample StndDev and Atr bands chart containing the average true range indicator.
For more information on NeuroShell Trader, visit www.NeuroShell.com.
--Marge Sherald, Ward Systems Group, Inc.GO BACK
301 662-7950, sales@wardsystems.com
https://www.neuroshell.com
GO BACK! Aiq Eds code for Average True Range and Standard Deviation Bands ! These can be plotted on price graph or used as entry/exit criteria for trades.Define AvgPd 20.!StDev Bands StdDev is Sqrt(Variance([close],AvgPd)). Stdh is ExpAvg([close],AvgPd) + 2 * StdDev. Stdl is ExpAvg([close],AvgPd) - 2 * StdDev.TrueRange is max([high]-[low],max([high]-val([close],1),val([close],1)-[low])).AvgTrueRange is SimpleAvg(TrueRange,AvgPd).!ATR Bands Stdha is ExpAvg([close],AvgPd) + 2 * AvgTrueRange. Stdla is ExpAvg([close],AvgPd) - 2 * AvgTrueRange.--AIQ Technical Support
Alternatively, you could use the existing Bollinger Bands functions as the standard deviation bands.StDev Band High Short Name: stdhInputs: Data, Period, Width Add (MA (Data, Period), Mult (StDev (Data, Period), Width))StDev Band Low Short Name: stdlInputs: Data, Period, Width Sub (MA (Data, Period), Mult (StDev (Data, Period), Width)) ATR Band High Short Name: stdha Inputs: Close, High, Low, Period, Width Add (MA (Close, Period), Mult (ATR (Close, High, Low, Period), Width)) ATR Band Low Short Name: stdla Inputs: Close, High, Low, Period, Width Sub (MA (Close, Period), Mult (ATR (Close, High, Low, Period), Width))
GO BACK--Gary Geniesse, TradingSolutions Project Lead NeuroDimension, Inc., 800 634-3327, 352 377-5144 info@tradingsolutions.com, www.tradingsolutions.com
All of these functions are available in a function file that can be downloaded from our website in the Solution Library section. They can then be imported into TradingSolutions using "Import Functions..." from the File menu. To apply one of these imported functions to a stock or group of stocks, select "Add New Field..." from the context menu for the stock or group, select "Calculate a value...", then select the desired function from the "Traders Tips Functions" group.Moving Average (Elastic Volume Weighted) Short Name: eVWMA Inputs: Price, Volume, Floating Shares If (Prev (1), Div (Add (Mult (Sub (Floating Shares, Volume), Prev (1)), Mult (Volume, Price)), Floating Shares), Price)
--Gary Geniesse, TradingSolutions Project LeadGO BACK
NeuroDimension, Inc., 800 634-3327, 352 377-5144
info@tradingsolutions.com, www.tradingsolutions.com
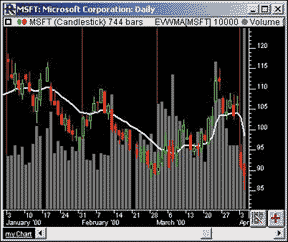
FIGURE 5: Investor/RT. This Investor/RT chart shows the elastic volume-weighted moving average (eVWMA) drawn in white, overlaying both the candlesticks and volume bars of a daily chart of Microsoft.
To add this line to a chart in Investor/RT, click on the "Add Technical
Indicator" button in the main toolbar and choose "Elastic Volume Weighted
MA" from the list. The eVwma line in the chart above is created using the
preferences shown in Figure 6.
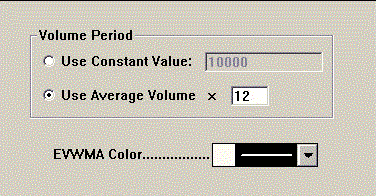
FIGURE 6: Investor/RT. The eVWMA line in the chart in Figure 6 is created using the preferences shown here.
The second volume period option, "Use average volume," gives the
user the ability to base his volume period on a multiple of the average
volume of the symbol in the chart, thereby making the indicator both symbol-independent
and time frame-independent. If either the time frame or the underlying
symbol in this chart were changed, the eVWMA settings would still apply,
basing the new volume period on the new ticker symbol-timeframe combination.
This aspect is especially useful in scans, where the eVWMA token is "Evw."
--Chad Payne, Linn Software, Inc.GO BACK
800 546-6842, sales@linnsoft.com
https://www.linnsoft.com
The Investor/RT chart in Figure 7 shows the average true range bands
drawn in blue, along with the standard deviation bands drawn in red. The
black line in the middle represents the 20-period moving average.
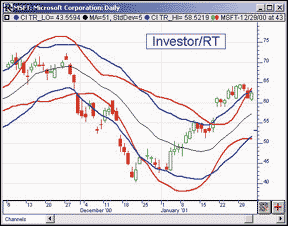
FIGURE 7: Investor/RT. This Investor/RT chart shows the average true range bands drawn in blue, along with the standard deviation bands drawn in red. The black line in the middle represents the 20-period moving average.
The standard deviation bands are applied by adding the moving average
channel indicator to the chart with the preferences specified in Figure
8.
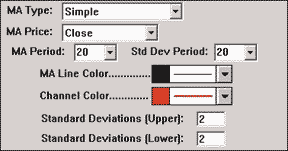
FIGURE 8: Investor/RT. The standard deviation bands are created on the Investor/RT chart in Figure 7 by adding the moving average channel indicator to the chart with the preferences specified here.
The average true range bands require creating two Investor/RT custom indicators and then adding each to the chart. From the menu, choose "Setup: Custom Indicators." Specify the following syntax for the first custom indicator:
MA + 2 * TR
Then click the Save button. It will then ask you for your moving
average and true range preferences. Both should be set up with a 20-period
simple smoothing. Give the custom indicator the name "TR_HI_BAND." Next,
repeat this process, this time using the syntax:
Save this custom indicator with the name "TR_LO_BAND." Now, go back to your chart, click the "Add Technical Indicator" button in the chart toolbar, and choose the custom indicator "TR_HI_BAND." Choose a color and click "Apply," then choose "TR_LO_BAND" and click OK. Your two TR bands may be in a separate window pane. Simply drag them into the same pane as your price bars. Double-click in the vertical scan and ensure that "Use Multiple Scales" is unchecked.MA - 2 * TR
--Chad Payne, Linn Software, Inc.GO BACK
800 546-6842, sales@linnsoft.com
https://www.linnsoft.com
The following script draws both the standard deviation and average true range bands on the same chart (Figure 9). It also creates a new chart pane where we display the total number of times prices closed outside of both types of bands.
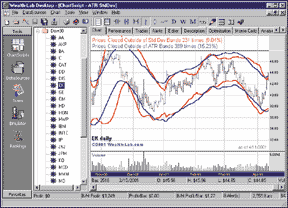
FIGURE 9: WEALTH-LAB. This chart shows both the standard deviation and average true range bands on the same chart. It also creates a new chart pane showing the total number of times prices closed outside both types of bands.
{ Construct Std Dev Bands }
StdDevBand := MultiplySeriesValue( StdDev( #Close, 20 ), 2.0 );
StdH := AddSeries( WMA( #Close, 20 ), StdDevBand );
StdL := SubtractSeries( WMA( #Close, 20 ), StdDevBand );
{ Plot Std Dev Bands } PlotSeries( StdH, 0, #Red, 2 ); PlotSeries( StdL, 0, #Red, 2 );{ Construct ATR Bands } AtrBand := MultiplySeriesValue( ATR( 20 ), 2.0 ); AtrH := AddSeries( WMA( #Close, 20 ), AtrBand ); AtrL := SubtractSeries( WMA( #Close, 20 ), AtrBand );{ Plot ATR Bands } PlotSeries( AtrH, 0, #Blue, 2 ); PlotSeries( AtrL, 0, #Blue, 2 );{ Count the number of times prices close outside of each band type } OutStdDev := 0; OutAtr := 0; for Bar := 20 to BarCount - 1 do begin if ( PriceClose( Bar ) > GetSeriesValue( Bar, StdH ) ) or ( PriceClose( Bar ) < GetSeriesValue( Bar, StdL ) ) then Inc( OutStdDev ); if ( PriceClose( Bar ) > GetSeriesValue( Bar, AtrH ) ) or ( PriceClose( Bar ) < GetSeriesValue( Bar, AtrL ) ) then Inc( OutATR ); end;{ Create a new Pane to hold our counts } NewPane := CreatePane( 30, true, false );{ Output our counts } DrawText( 'Prices Closed Outside of Std Dev Bands ' + IntToStr( OutStdDev ) + ' times (' + FormatFloat( '#,##0.00%', OutStdDev * 100 / BarCount ) + ')', NewPane, 4, 4, #Red, 10 );DrawText( 'Prices Closed Outside of ATR Bands ' + IntToStr( OutAtr ) + ' times (' + FormatFloat( '#,##0.00%', OutATR * 100 / BarCount ) + ')', NewPane, 4, 20, #Blue, 10 );Content-Type: image/bmp; name="AtrStdDev.bmp" Content-Disposition: attachment; filename="AtrStdDev.bmp"
--Dion Kurczek, Wealth-Lab.comGO BACK
773 883-9047, dionkk@ix.netcom.com
https://www.wealth-lab.com
Once you know the float, you can use it to compute Fries's eVWMA indicator. In the following script, we use the current float for the stock POWI. Replace this with the float of the stock that you're charting before running the script.
GO BACKFlt := 16000000.0; {For Symbol POWI, replace with the Float for the Stock that you are charting}evwma := CreateSeries(); prev := PriceClose( 0 ); for Bar := 1 to BarCount - 1 do begin x := ( ( Flt - Volume( Bar ) ) * prev + Volume( Bar ) * PriceClose( Bar ) ) / Flt; SetSeriesValue( Bar, evwmav, x ); prev := x; end; PlotSeries( SMA( evwmav, 20 ), 0, #Green, 2 ); PlotSeries( SMA( #Close, 20 ), 0, #Blue, 2 );
--Dion Kurczek, Wealth-Lab.com
773 883-9047, dionkk@ix.netcom.com
https://www.wealth-lab.com
Formula for the Elastic Volume Weighted Moving AverageNAME: eVWMA SWITCHES: recursive PARAMETERS: 565000 INITIAL VALUE: C FORMULA: ( (&1-V) * T + (V*C) ) / &1
Visit RTR's website to download this formula as well as program
updates.
--Clay Burch, Rtr SoftwareGO BACK
919 510-0608, rtrsoft@aol.com
https://www.rtrsoftware.com
Formula for ATR Bands
NAME: ATRBands
SWITCHES: multiline
PARAMETERS: 20,2
FORMULA: [1]: ((H%CY1)-(L#CY1))X&1 {ATR}
 [2]: CX&1          {c}{Nmiddle} {rgb#255}
 [3]: [2]+([1]*&2)  {c}{Nupper}  {rgb#255}
 [4]: [2]-([1]*&2)  {c}{Nlower}  {rgb#255}
Formula for Standard Deviation Bands NAME: SDBands SWITCHES: multiline PARAMETERS: 20,2 FORMULA: [1]: C|&1 {SD} [2]: CX&1 {c}{Nmiddle} {rgb#32768} [3]: [2]+([1]*&2) {c}{Nupper} {rgb#32768} [4]: [2]-([1]*&2) {c}{Nlower} {rgb#32768}
Visit Rtr's website to download this formula as well as program
updates.
GO BACK
--Clay Burch, Rtr Software
919 510-0608, rtrsoft@aol.com
https://www.rtrsoftware.com
Although two standard deviations from the mean (or average) encompasses
95.45% of a normally distributed population, Gustafson's use of an exponential
average as the base yields interesting results.
GO BACKA: DATE @TC2000(C:\TC2000V3\Data,SP-500,Standard & Poors 500,DB) B: HIGH C: LOW D: CLOSE E: OPEN F: VOL G: Eavg @EAVG1(CLOSE,20) H: STDH EAVG + 2*@STD(CLOSE,20) I: STDL EAVG - 2*@STD(CLOSE,20) J: Trange @TR(HIGH,LOW,CLOSE,1) K: STDHA EAVG + 2*@MAVG(TRANGE,20) L: STDLA EAVG - 2*@MAVG(TRANGE,20) M: '==========End Formulas
--Peter Di Girolamo, Jerome Technology
908 369-7503, jtiware@aol.com
https://members.aol.com/jtiware
A: DATE   @TC2000(C:\TC2000V3\Data,AOL,Aol Time Warner,DB)
B: HIGH
C: LOW
D: CLOSE
E: OPEN
F: VOL
G:
H: Float  'Enter Shares Floating here (Authors value=565000)
I: eVWMA  @INIT(1,CLOSE); ((FLOAT-VOL)*EVWMA[-1] + VOL*CLOSE)/FLOAT
J: Mavg   @MAVG(CLOSE,20)
K: '==========End Formulas
--Peter Di Girolamo, Jerome TechnologyGO BACK
908 369-7503, jtiware@aol.com
https://members.aol.com/jtiware