Security Comparisons
Relative Strength
by Martin J. Pring
What to short and what to buy - you should always know the choices the market's giving you.
Relative strength measures the relationship
between two securities. By security, I am referring to any freely traded
entity, be it a market, stock, currency, commodity, and so forth. Note
that relative strength, as used here, has nothing to do with J. Welles
Wilder's relative strength indicator (RSI). RSI is an indicator that measures
a security's price relative to itself over a specific period and is plotted
as an oscillator.
Relative strength, as discussed here, is comparative relative strength. To find this measurement, the price of one security is divided by another. The result is plotted as a continuous line.
There are several ways in which this concept is applied to the marketplace. For example, we can compare one asset to another in order to decide which to buy or to better understand an intermarket relationship. In this case, we might compare bonds to gold to see whether the bond price is in a rising trend relative to gold. If so, this could mean that a deflationary trend is unfolding.
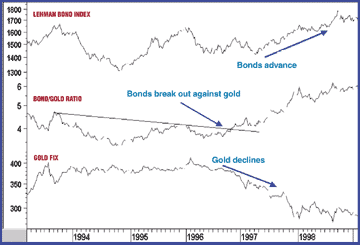
Figure 1 features an example. Bonds are plotted in the top panel and
gold in the bottom one. The center panel contains the bond/gold relationship.
When the line is rising, it is bullish for bonds relative to gold and vice
versa. In November 1996, the ratio broke to the upside, indicating a deflationary
trend - one favoring bonds. After that point, bonds rally and gold declines.

FIGURE 1: BONDS AND GOLD. Once the ratio of bonds to gold breaks its downtrend, the two markets diverge, providing a trading opportunity.
Another possibility to utilize a relative strength measurement arises when a review of the technical position indicates that both the US and the Japanese stock markets are in a bullish trend. Analyzing the trend of relative strength between the two shows which market is likely to outperform the other.
In this regard, Figure 2 shows the Nikkei in the top panel and the Standard
& Poor's 500 in the bottom one. The center panel again features a ratio,
this time the Nikkei against the S&P. Just after the 1987 crash both
markets were positive, but the relative strength line broke to the upside,
indicating that the Nikkei, ignoring currency fluctuations, would have
been the better choice.
...Continued in the July 2001 issue of Technical Analysis of STOCKS & COMMODITIES
Martin J. Pring founded the International Institute for Economic Research in 1981. He pioneered the introduction of videos as an educational tool for technical analysis in 1987 and was the first to introduce educational interactive CDs in this field. His website is www.Pring.com, and he may be reached at info@Pring.com.
Excerpted from an article originally published in the July 2001 issue of Technical Analysis of STOCKS & COMMODITIES magazine. All rights reserved. © Copyright 2001, Technical Analysis, Inc.
Return to July 2001 Contents