Slow And Steady Earn The Simoleons
Trading The Turtle System On Currencies
by Guy Brys, Anja Struyf, and Luc Van Hof
The system was developed two decades ago on the basis of a bet, but since then, it's been a proven winner. The Turtle system was developed on daily data but it has some promising real-life results when used with intraday data, in this case currencies.
We tested the infamous Turtle system in intraday trading on foreign exchange markets, using a large database of historical rates. We examined all four components of the system (entry, exit, trading size, and money management) and developed parameter values through optimization on a training set of data. Our results compared well with the study that former Turtle Russell Sands conducted in 1995 on daily data, and the method was profitable when assessed by total net profit (the equity curve), the return-to-risk ratio, and the Sharpe ratio?.
After considering the many assets that can be traded, such as stocks, options, futures, commodities, and foreign currencies, we decided to focus on exchange rates. You may apply the same approach to other assets, but you will need to establish different parameters. For the sake of simplicity, we assumed a constant trading size of US$10,000. We tested the yen (JPY), the Swiss franc (CHF), and the euro (EUR).
THE TURTLE STRATEGY
The Turtle strategy, which was developed by Richard Dennis and William Eckhardt around 1983, is based on the simple observation that the market is not always tradable. The market can be in a trend?, or it can be in a consolidation?. Consolidations are dangerous to trade, since you never know what the market will do if it comes out of the consolidation.
So the Turtle system tries to avoid trading in a consolidation period. Often, a consolidation ends with the start of a new trend. The longer the consolidation lasts, the stronger the following trend tends to be.
The strategy consists of two simple rules. One rule tries to capture the start and the direction of a trend, and thus determine the entry price of the trade. The other decides when to exit the trade. These rules are:
1. Buy long (or sell short) when the market makes a higher high (or a lower low) than in the past n-entry periods.2. Sell long (or buy short) when the market makes a lower low (or a higher high) than in the past n-exit periods.
These rules contain two parameters - n-entry and n-exit - that need to be chosen. We expressed n-exit as a fraction of n-entry by using a factor C, which is defined as follows:
nexit = C * nentry
Russell Sands, a former Turtle trader for Richard Dennis, wrote in a 1995 work that the Turtles systematically set C equal to 1/2 and that seems to be a good choice. We have tested other values ranging from 1/16 to 1, but none of them gave better results for the currencies considered.
To reduce the risk of a given trade, the Turtle system also includes a money management stop, ensuring that not more than 2% of the capital can be lost on any particular trade. As soon as the trade goes against you to the extent that you lose 2% of your capital, you exit the trade (that is, you take your loss instead of accepting the risk of losing more than 2%).

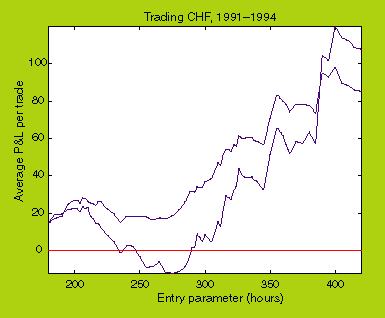
Figure 1A: CHF. Average P&L per trade when applying the Turtle strategy to the CHF using the parameter n-entry, from January 1991 to December 1994 (in-sample). The thick and thin lines show the results with and without a money management stop.
...Continued in the August 2001 issue of Technical Analysis of STOCKS & COMMODITIES
Guy Brys and Anja Struyf are members of the Department of Mathematics and Computer Science, Universitaire Instelling Antwerpen (UIA), Universiteitsplein 1, B-2610, Antwerp, Belgium. Luc Van Hof is CEO of AIM Trading, a Belgian CTA managing assets in the foreign exchange and derivatives markets. He also teaches investment management classes at Brussels University. The authors can be reached at gbrys@uia.ua.ac.be.
Excerpted from an article originally published in the August 2001 issue of Technical Analysis of STOCKS & COMMODITIES magazine. All rights reserved. © Copyright 2001, Technical Analysis, Inc.
Return to August 2001 Contents