Is It Possible To Time Swings And Trends?
Timing The Move
by Lorne W. Rae
All traders want to know in advance how long a price trend will last. Try predicting it with this technique.
A note in Robert Edwards and John Magee's Technical Analysis Of Stock Trends states, "Volume is of the utmost importance in all technical phenomena," but then Edwards and Magee add, "... the exact number of shares traded is not important." Over the half century since this work was first published, not a lot of attention has been paid to absolute volume, but it's time to take a closer look at this concept. We might just find that the number of shares traded can indicate the length of a price trend.
SHAREHOLDERS AND PRICE
Price is determined at a moment in time when two individuals (or their agents) meet and agree to exchange a specific amount of money for a certain number of shares of stock. Once they finish their business, they depart and are replaced by another pair of individuals who establish the next price, and so on.
Long-term investors lock their core holdings away for safekeeping. By doing so, they play little role in determining a stock's price. It is the traders -- those who actually buy and sell -- who determine price. The behavior of these two types of shareholders is illustrated in Figure 1. The example starts with five shareholders (A, B, C, D, and E), and each holds one share. Three of them (A, B, and C) are long-term investors and hold throughout the entire period. D has a shorter time horizon and sells to F. Another seller is E; the buyer is G, who sells to H, who in turn sells to I. In this example, the price of the stock is established four times. Investors A, B, and C are not involved and only two of the five shares actually trade. The cumulative volume is four shares, or twice the number owned by the shareholders who trade. This last distinction is very important.

Figure 1: INVESTORS AND TRADERS. The former hold, while the latter buy and sell.
In the real world, there appears to be a relationship between the
cumulative trading volume of a stock and the length of time a price trend
lasts. This is especially applicable for many (but not all) of those large
and profitable companies that are typically found in both institutional
and individual portfolios. This relationship, which usually escapes notice,
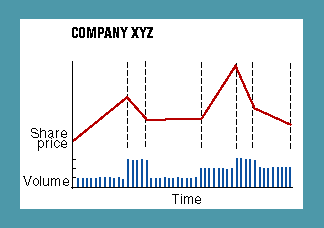
is illustrated in Figure 2.

Figure 2: THE PRINCIPLE OF SIMILAR VOLUME. Each price trend, regardless of its length, has the same cumulative trading volume.
In this example, the price line for XYZ's stock is divided into
six segments, each corresponding to a price trend. The volume, per unit
of time, can be seen below the price line. Note that the longer a price
trend lasts, the lower its volume per unit of time is, and vice versa.
At first glance, the cumulative volume associated with each price trend
looks different, but it is in fact the same. In other words, cumulative
trading volume is similar between price trends, regardless of their length.
I call this the principle of similar volume and it is central to this theory.
But it's only half of the story.
THE RULE
To make the theory complete, you must assign a number to the cumulative
trading volume for each individual stock. Put another way: For any company,
what is the cumulative volume associated with each swing in its stock price?
This question gives rise to the rule.
...Continued in the August 2001 issue of Technical Analysis of STOCKS & COMMODITIES
Lorne W. Rae, MA, CFA, is director of research with Dixon Mitchell Rae Investment Counsel, Inc. in Vancouver, British Columbia, Canada. He can be reached at 604 669-3136.
Excerpted from an article originally published in the August 2001 issue of Technical Analysis of STOCKS & COMMODITIES magazine. All rights reserved. © Copyright 2001, Technical Analysis, Inc.
Return to August 2001 Contents