August 2001
TRADERS' TIPS
You can copy these formulas and programs for easy use in your spreadsheet or analysis software. Simply "select" the desired text by highlighting as you would in any word processing program, then use your standard key command for copy or choose "copy" from the browser menu. The copied text can then be "pasted" into any open spreadsheet or other software by selecting an insertion point and executing a paste command. By toggling back and forth between an application window and the open Web page, data can be transferred with ease.
This month's tips include formulas and programs for:
or return to August 2001 Contents
![]() TRADESTATION
EASYLANGUAGE: BALANCE OF MARKET POWER
TRADESTATION
EASYLANGUAGE: BALANCE OF MARKET POWER
Igor Livshin's balance of market power (BMP) indicator, described elsewhere in this issue, can be considerably simplified for efficient implementation. If you do the math, you'll find that the raw BMP is actually equivalent to (Close-Open) / (High-Low). Given this, TradeStation's EasyLanguage version of this indicator is written as follows:
The indicator includes the default value of 14 for the smoothing average, and this can be edited at the time the indicator is applied to a chart.inputs: Length( 14 ); variables: BMP( 0 ); BMP = ( Close - Open ) / ( High - Low ); Plot1( Average( BMP, Length ) ) ;
--Ramesh Dhingra, Product Manager, EasyLanguage
TradeStation Technologies, Inc.
(formerly Omega Research, Inc.)
A wholly owned subsidiary of TradeStation Group, Inc.
https://www.TradeStation.com
![]() TRADESTATION
EASYLANGUAGE: SEASONAL TRADE
TRADESTATION
EASYLANGUAGE: SEASONAL TRADE
My article "Trade Crude Now" in this issue combines a simple option spread with a seasonal trade using a three-channel breakout method. By using a simple channel breakout system, the actual market movement will signal when and where you should enter and exit a trade. Here is the TradeStation code to implement the crude oil trade described in my article.
CRUDE OIL SEASONAL TRADE #2
If Month(d) = 8 then buy ("Long") next bar at
Highest (H,5) + 1 point stop;
ExitLong from entry ("Long") next bar at$ Lowest (L,3) - 1 point stop; (This is not active on the day of entry so the protective stop for that day will need to be computed by hand.)
If EntryPrice<=Lowest (L,8)-1 point then ExitLong at Lowest (L,8)-1 point stop; (Profit Stop)
If (Month(d)=9 and DayOfMonth(d)>26 ) or Month(d)=10 then ExitLong on close;
--John MomsenGO BACK
![]() METASTOCK
FOR WINDOWS: BALANCE OF MARKET POWER
METASTOCK
FOR WINDOWS: BALANCE OF MARKET POWER
The balance of market power (BMP) indicator, presented by Igor Livshin in his article in this issue, can be easily recreated in MetaStock 6.52 or higher. To create the BMP in MetaStock, select the "Indicator Builder" from the Tools menu. Then click "New" and enter the following formula:
BMP
THL:=If(H-L=0,.00001,H-L);
{Reward Based on the Open}
BuRBoO:=(H-O)/(THL); BeRBoO:=(O-L)/(THL); {Reward Based on the Close}BuRBoC:=(C-L)/(THL); BeRBoC:=(H-C)/(THL); {Reward Based on the Open-Close}BuRBoOC:=If(C>O,(C-O)/(THL),0); BeRBoOC:=If(C>O,0,(O-C)/(THL)); BMP:=(BuRBoO+BuRBoC+BuRBoOC)/3 - (BeRBoO+BeRBoC+BeRBoOC)/3; BMP
To plot the moving average, add the following line to the
formula:
Note: You can replace "14" with your desired number of periods.Mov(BMP,14,S)
--Cheryl C. Abram, Equis International, Inc.
https://www.equis.com
![]() METASTOCK
FOR WINDOWS: SEASONAL TRADE
METASTOCK
FOR WINDOWS: SEASONAL TRADE
In MetaStock 6.52 or higher, you can recreate the crude oil seasonal trade #2 described in John Momsen's article in this issue, "Trade Crude Now." In MetaStock, select "System tester" from the Tools menu. Click "New" and enter the following formulas:
Name: Crude Oil Seasonal Trade #2
Enter Long:
Month()=8 AND H>=HHV(Ref(H,-1),5)+1Close Long:
 bc:=Month()=8 AND H>=HHV(Ref(H,-1),5)+1;
 sc:=L<=LLV(Ref(L,-1),3)-1;
 trade:=If(bc,1,If(sc,0,PREV));
sc OR
 If(ValueWhen(1,Cross(trade,.5),H)< LLV(Ref(L,-1),8)-1,L<= LLV(Ref(L,-1),8)-1,0)
  OR (Month()=9 AND DayOfMonth()>=26)
  OR Month()=10
Click OK and then click "Test" to run the system.
--Cheryl C. Abram, Equis International, Inc.
https://www.equis.com
![]() NEUROSHELL
TRADER: BALANCE OF MARKET POWER
NEUROSHELL
TRADER: BALANCE OF MARKET POWER
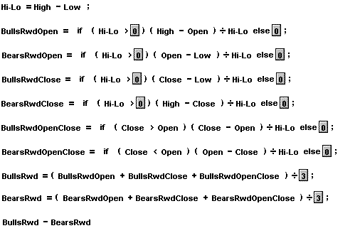
To implement Igor Livshin's balance of market power (BMP) indicator in NeuroShell Trader, you should first create all the component indicators. Select "New Indicator É" from the Insert menu to create each of the following indicators using the Indicator Wizard:
The final step is to create the balance of market power indicator. Select "New Indicator ..." from the Insert menu to create the following indicator using the Indicator Wizard:BullsRewardBasedOnOpen: Divide ( Sub(High,Open), Sub(High,Low) ) BearsRewardBasedOnOpen: Divide ( Sub(Open,Low), Sub(High,Low) ) BullsRewardBasedOnClose: Divide ( Sub(Close,Low), Sub(High,Low) ) BearsRewardBasedOnClose: Divide ( Sub(High,Close), Sub(High,Low) ) BullsRewardBasedOnOpenClose: If ( A>B(Close,Open), Divide(Sub(Close,Open), Sub(High,Low)), 0 ) BearsRewardBasedOnOpenClose: If ( A>B(Close,Open), 0, Divide(Sub(Open,Close), Sub(High,Low)) ) BullsRewardDaily: Average3(BullsRewardBasedOnOpen,BullsRewardBasedOnClose,BullsRewardBasedOnOpenClose) BearsRewardDaily: Average3(BearsRewardBasedOnOpen,BearsRewardBasedOnClose,BearsRewardBasedOnOpenClose)
BalanceOfMarketPower:
Subtract ( BullsRewardDaily, BearsRewardDaily )
A sample display of the balance of market power indicator is shown in Figure
1.
Users of NeuroShell Trader can go to the Stocks & Commodities section of NeuroShell Trader's free technical support website to download a sample BalanceOfMarketPower chart. The sample chart contains the BalanceOfMarketPower saved as a custom indicator for use in your own charts. For more information on NeuroShell Trader, visit NeuroShell.com.Figure 1: NEUROSHELL TRADER: Balance of market power. This NeuroShell Trader chart graphically displays the balance of market power indicator.
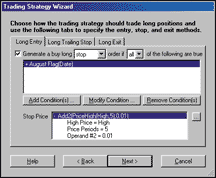
Figure 2: NEUROSHELL TRADER: SEASONAL TRADE. Here's how to select the long entry conditions in NeuroShell Trader.
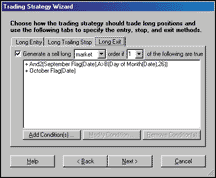
Figure 3: NEUROSHELL TRADER: SEASONAL TRADE. Here's how to select the long exit conditions in NeuroShell Trader.
--Marge Sherald, Ward Systems Group, Inc.
301 662-7950, sales@wardsystems.com
https://www.neuroshell.com
![]() NEUROSHELL
TRADERS: SEASONAL TRADE
NEUROSHELL
TRADERS: SEASONAL TRADE
John Momsen's crude oil trade #2 can be easily implemented in the NeuroShell Trader Trading Strategy Wizard by inserting Momsen's rules into the correct places as follows.
To insert the strategy:
1. Select "Insert - New Trading Strategy"
2. On the Long Entry tab (Figure 2):
A. Select to generate a buy long stop order if all of the following are true3. On the Long Trailing Stop tab (Figure 3), add the price level ?
B. Insert the condition "August Flag(Date)"
C. Insert the stop value - Add2(Price High(High,5), 0.01)
4. On the Long Exit tab:If Entry Price(Trading Strategy, 0) <= Sub(Lowest Price(Low, 8), 0.01 Then Sub(Lowest Price(Low, 8), 0.01) Else Sub(Lowest Price(Low, 3), 0.01)
A. Select to generate a sell long market order if one of the following are trueWe've created the crude oil trade #2 system you can download from NeuroShell Trader's free technical support website. If you place the provided chart in your template directory, you can apply this system to any new chart that you create.
B. Insert the condition "And2(September Flag(Date), A>B(Day of Month(Date), 26))"
C. Insert the condition "October Flag(Date)"
Users of NeuroShell Trader can go to the Stocks & Commodities section of NeuroShell Trader's free technical support website to download this or any past Traders' Tips.
--Marge Sherald
Ward Systems Group, Inc.
301 662-7950, sales@wardsystems.com
https://www.neuroshell.com
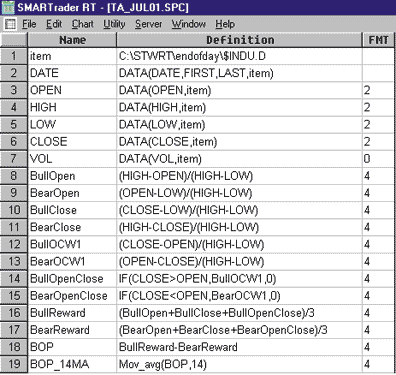
![]() INVESTOR/RT:
BALANCE OF MARKET POWER
INVESTOR/RT:
BALANCE OF MARKET POWER
This balance of market power indicator discussed this month by Igor Livshin breaks down to nothing more than:
(CL - OP) / (HI - LO)
regardless of whether the CL is greater than OP. When you plug in
the variables and break it down to its simplest form, you get:
Change / Range
Livshin's article goes on to describe a much more complicated spreadsheet calculation, whereas only one computed column is really needed, as opposed to seven. [Editor: You are correct. I could have condensed it for the Excel model, but I followed the graphic explanation, which our Excel model captured.]
Nonetheless, this may still be a very effective indicator.
--Chad Payne, Linn Software, Inc.
800 546-6842, www.linnsoft.com
![]() INVESTOR/RT:
VIMA
INVESTOR/RT:
VIMA
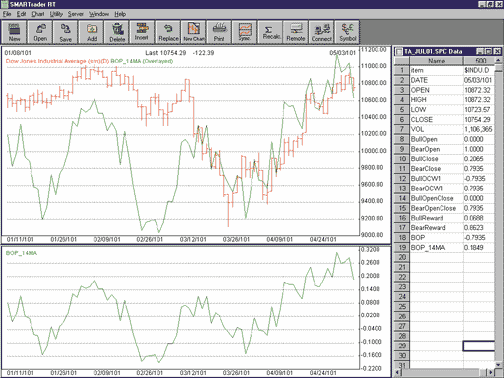
Last month in the July 2001 STOCKS & COMMODITIES, in his article "Variable-Interval Moving Averages," R.G. Boomers presented VIMA, a responsive, adjustable-length moving average.
Figure 4 is an Investor/RT chart showing a volatility-adjusted moving
average overlaying a daily bar chart of Microsoft, along with a volatility
indicator in the lower chart pane.
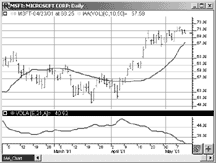
FIGURE 4: INVESTOR/RT: VIMA. Here is an Investor/RT chart showing a volatility-adjusted moving average overlaying a daily bar chart of Microsoft, along with a volatility indicator in the lower chart pane.
The Investor/RT indicator named Indicator Adjusted Average allows
the user to create a moving average whose period varies within a specified
range and is determined based on the value of any other selected indicator
within that indicator's range. The indicator used to control the variance
of the moving average period can be any of the 80+ predefined indicators,
or even a custom indicator created using the Investor/RT Rtl language.
The preferences for the Indicator Adjusted Average are shown in Figure
5.
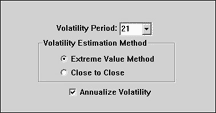
FIGURE 5: INVESTOR/RT: VIMA. The Investor/RT built-in indicator named Indicator Adjusted Average allows the user to create a moving average whose period varies within a specified range. The preferences for the Indicator Adjusted Average are shown here.
The best way to simulate the variable-interval moving average discussed
by Boomers in his July 2001 article is to use the volatility indicator
as the underlying indicator in the indicator adjusted average study and
assign a range of periods from 10 to 50. In this example, the volatility
is set for a period of 21 bars, as seen in Figure 6. This window can be
accessed by clicking on the "Indicator preferences" button in the Indicator
Adjusted Average window.
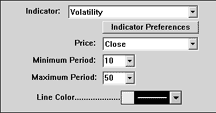
FIGURE 6: INVESTOR/RT: VIMA. The volatility is set for a period of 21 bars, as seen here. This window can be accessed by clicking on the "Indicator preferences" button in the Indicator Adjusted Average window in Investor/RT.
The range of maximum and minimum volatility values will be calculated
and then compared to the volatility values for each bar to decide which
period between the maximum/minimum range will be used to compute the moving
average for that bar. The Indicator Adjusted Average may also be used in
the Investor/RT Scan language to automatically search for crossovers or
breakouts. The scan token is IAA.
--Chad Payne, Linn Software, Inc.
800 546-6842, sales@linnsoft.com
https://www.linnsoft.com
![]() TRADINGSOLUTIONS:
BALANCE OF MARKET POWER
TRADINGSOLUTIONS:
BALANCE OF MARKET POWER
The article "Balance Of Market Power" by Igor Livshin in this issue presents
a series of calculations that can be performed to measure the strength
of bulls versus bears to push the price to an extreme level. These calculations
can be entered as functions into TradingSolutions as follows:
Bulls Reward Based On Open
Short Name: BMP_BullOpen
Inputs: Open, High, Low
Div (Sub (High,Open),Sub (High,Low))
Bears Reward Based On Open Short Name: BMP_BearOpen Inputs: Open, High, Low Div (Sub (Open,Low),Sub (High,Low))Bulls Reward Based On Close Short Name: BMP_BullClose Inputs: Open, High, Low Div (Sub (Close,Low),Sub (High,Low))Bears Reward Based On Close Short Name: BMP_BearClose Inputs: Close, High, Low Div (Sub (High,Close),Sub (High,Low))Bulls Reward Based On Open Close Short Name: BMP_BullOpen Inputs: Open, Close, High, Low If (GT (Close,Open),Div (Sub (Close,Open),Sub (High,Low)),0)Bears Reward Based On Open Close Short Name: BMP_BearOpen Inputs: Open, Close, High, Low If (GT (Close,Open),0,Div (Sub (Open,Close),Sub (High,Low)))Bulls Reward Daily Short Name: BMP_BullDaily Inputs: Open, Close, High, Low Avg3 (BMP_BullOpen (Open,High,Low),BMP_BullClose (Close,High,Low), BMP_BullOpenClose (Open,Close,High,Low))Bears Reward Daily Short Name: BMP_BearDaily Inputs: Open, Close, High, Low Avg3 (BMP_BearOpen (Open,High,Low),BMP_BearClose (Close,High,Low), BMP_BearOpenClose (Open,Close,High,Low))Balance of Market Power (Original Form) Short Name: BMP1 Inputs: Open, Close, High, Low Sub (BMP_BullDaily (Open,Close,High,Low),BMP_BearDaily (Open,Close,High,Low))
You may notice that all of the terms are relative to the range between
high and low. Further, all the terms are included in averages of three
items. After all the terms are combined, the conditional statement in the
"Open Close" functions resolves to a single nonconditional Sub (Close,Open)
statement. Because of this, the balance of market power function can be reduced
to the following formula:
Balance of Market Power
Short Name: BMP
Inputs: Open, Close, High, Low
Div (Sub (Close,Open),Sub (High,Low))
A sample TradingSolutions chart displaying the balance of market power
is shown in Figure 7.
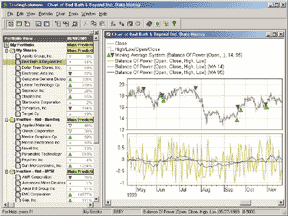
Figure 7: TradingSolutions: BALANCE OF MARKET POWER. Here's a chart of the balance of market power indicator with 14- and 95-day moving averages and an entry/exit signal based on those averages.
All of these functions are available in a function file that can
be downloaded from our website in the Solution Library section. They can
then be imported into TradingSolutions using "Import Functions..." from
the File menu.
To apply one of these imported functions to a stock or group of stocks, select "Add New Field..." from the context menu for the stock or group, select "Calculate a value...," then select the desired function from the "Traders Tips Functions" group.
--Gary Geniesse, NeuroDimension, Inc.
800 634-3327, 352 377-5144
info@tradingsolutions.com, www.tradingsolutions.com
![]() WEALTH-LAB.COM
BALANCE OF MARKET POWER
WEALTH-LAB.COM
BALANCE OF MARKET POWER
Here is a Wealth-Lab ChartScript that implements the balance of market power indicator as described by Igor Livshin in this issue. You can use this script in Wealth-Lab Desktop or at the Wealth-Lab.com website. We plan to add balance of market power as a native indicator in the next point release of Wealth-Lab Desktop, which should be available by the time you read this.
{Create the Balance of Market Power Indicator }
BMP := CreateSeries;
for Bar := 0 to BarCount - 1 do
begin
o := PriceOpen( Bar );
h := PriceHigh( Bar );
l := PriceLow( Bar );
c := PriceClose( Bar );
if h <> l then
begin
BullRewardO := ( h - o ) / ( h - l ); BearRewardO := ( o - l ) / ( h - l ); BullRewardC := ( c - l ) / ( h - l ); BearRewardC := ( h - c ) / ( h - l ); if c > o then beginBullRewardOC := ( c - o ) / ( h - l ); BearRewardOC := 0.0;end else beginBearRewardOC := ( o - c ) / ( h - l ); BullRewardOC := 0.0;end; BullRewardDaily := ( BullRewardO + BullRewardC + BullRewardOC ) / 3; BearRewardDaily := ( BearRewardO + BearRewardC + BearRewardOC ) / 3; BMPValue := BullRewardDaily - BearRewardDaily; SetSeriesValue( Bar, BMP, BMPValue );end;
end;
{Plot BMP}
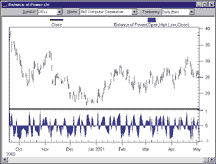
HideVolume;
BMPPane := CreatePane( 150, false, true );
PlotSeries( SMA( BMP, 14 ), BMPPane, #Navy, 2 );
PlotSeries( SMA( BMP, 52 ), BMPPane, #Maroon, 2 );
DrawText( 'BMP 14 bar SMA', BMPPane, 4, 4, #Navy, 8 );
DrawText( 'BMP 52 bar SMA', BMPPane, 4, 16, #Maroon, 8 );
A sample chart is shown in Figure 8.
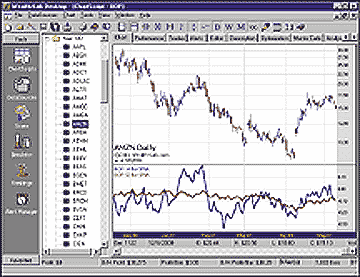
FIGURE 8: WEALTH-LAB: BALANCE OF MARKET POWER. Here is the balance of market power in a Wealth-Lab display.
--Dion Kurczek, Wealth-Lab.com
773 883-9047, dionkk@ix.netcom.com
https://www.wealth-lab.com
![]() WEALTH-LAB.COM:
SEASONAL TRADE
WEALTH-LAB.COM:
SEASONAL TRADE
You can reproduce John Momsen's seasonal breakout trading system at
the Wealth-Lab.com website or in Wealth-Lab Desktop using the following
script:
for Bar := 10 to BarCount - 1 do
begin
  dt := GetDate( Bar );
  if LastPositionActive then
  begin
    if not SellAtStop(Bar+1, (Lowest(Bar,#Low,3)-1), LastPosition) then
      if PositionBuyPrice(LastPosition)<(Lowest(Bar,#Low,3)-1) then
        SellAtStop(Bar + 1, (Lowest( Bar, #Low, 8 )- 1), LastPosition);
    if LastPositionActive then
      if (((GetDay(dt)>26) and (GetMonth(dt)= 9)) or (GetMonth(dt)=10)) then
        SellAtClose( Bar, LastPosition );
  end
  else
  begin
    if GetMonth( dt ) = 8 then
      BuyAtStop( Bar + 1, 5000, ( Highest( Bar, #High,5 ) + 1 ));
    end;
end;