TRADING SYSTEMS
CandleCodes can go one step beyond being coded
Light Up Your Trading System
With CandleCode Trading
by Viktor Likhovidov
Market sentiment has traditionally been associated with subjectivity. Here's a method that not only adds a quantitative bent to measuring market sentiment, but can also be applied to your trading.
When I first devised CandleCodes, I designed them to quantitatively measure the market by ranking the CandleCodes according to typical interpretations. To put it simply, the CandleCode assigns a rank to each candlestick. A strongly bearish candle will have a very low rank, whereas one with less bearish sentiment will get a slightly higher rank. A bullish candle will get a high rank and a strongly bullish candle will occupy the highest place in this hierarchy. This scheme has worked well and has introduced order to the world of candlestick charting.
But the soul of the chartist cannot simply enjoy the beauty of perfect order. The aesthetics of technical analysis assume that everything that looks beautiful should trade efficiently. Thus, the next step is to apply this quantitative measure of sentiment to your trading.
I will show you simple approaches to constructing trading systems using CandleCodes, as well as some of their modifications. CandleCode systems can easily be created and applied to various markets based on information presented in my article in the March 2001 Technical Analysis of STOCKS & COMMODITIES.
DETECTING TURNING POINTS
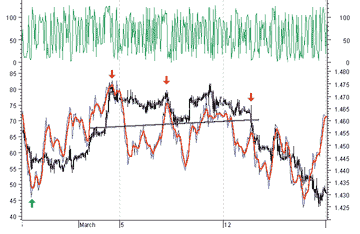
Figure 1 illustrates several useful properties of CandleCode in a candlestick
hourly chart of spot British pound from February 26 to March 15, 2001.
The upper graph (dark green line) represents the CandleCode, and the smoothed
CandleCode (blue line) - the 21-period simple moving average? - is overlaid
on the price chart. To filter some of the fluctuations, I also applied
a short smoothing operator triplet - triple two-point moving averages (three
consecutive two-point moving averages) to the 21-period moving average
of the CandleCode, the result of which is displayed as a red line. (For
more information on triple moving averages, see my article on CandleCodes
in the November 1999 STOCKS & COMMODITIES.)

FIGURE 1: CANDLECODE AND SMOOTHED CANDLECODE. The smoothed CandleCode indicator (blue) is able to detect essential turning points of the chart.
The red line in Figure 1 is not the moving average of price. It is from the upper graph, which has an appearance that is far from that of any reasonable price chart. It is evident from the chart that the double-smoothed CandleCode (red line) follows the main movements on the price chart. It has captured, without delay, one bullish reversal (February 26) and two bearish reversals (March 2 and 7) on the left half of the chart. It then adequately expressed consolidation of GBP in the 1.46 to 1.4750 range, giving timely signals (March 13) of possible breakout of the support line (double top formation, March 1 to March 13) and finitely generating the bullish signal ahead of the market's reversal on the right-hand side of the chart (March 15).
The ability of the CandleCode to give these timely signals may surprise
you. To further confirm its abilities, I will show you another example.
The chart in Figure 2 shows the hourly chart of the British pound between
March 23 and April 5, 2001. It contains the same double-smoothed red line
as Figure 1. After appropriate smoothing, the CandleCode has captured the
beginnings of all reversals, both bearish and bullish. Note that these
signals occurred during a sideways market and not during long-lasting trends.
Almost all reversal points of smoothed CandleCode gave timely signals.
At least visually, the CandleCode reflects important features of market
sentiment and detects changes of this sentiment. These properties could
certainly be taken advantage of in your trading.
...Continued in the September 2001 issue of Technical Analysis of STOCKS & COMMODITIES
Viktor Likhovidov, a financial analyst and consultant based in Vladivostok, Russia, performs research in the areas of pattern recognition, neural networks, and mathematical methods in currency markets analysis. He may be reached at ltfx@fastmail.vladivostok.ru or lita@math.dvgu.ru.
Excerpted from an article originally published in the September 2001 issue of Technical Analysis of STOCKS & COMMODITIES magazine. All rights reserved. © Copyright 2001, Technical Analysis, Inc.