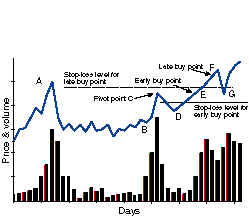
FIGURE 1: CUP-WITH-HANDLE. An idealized cup-with-handle pattern, showing two possible buy points and their stop-loss levels.
CLASSIC TECHNIQUES
Cup-With-Handle And The Computerized ApproachTrading Within The Cup
by Rick Martinelli and Barry Hyman
The classic approach to trading the cup-with-handle pattern is buying on a pullback during an uptrend before price breaks out. But what about traders who prefer to begin taking a position in a stock as it is setting up, rather than waiting for it to hit a new high? Trading within the cup-with-handle is another way to profit.
In our October 1998 article, we described an automated approach to identify stocks that have set up the cup-with-handle structure with proper price and volume characteristics. The impetus for writing such an algorithm is that, on any given day, there may be new stocks that break out of a cup-with-handle pattern, but by the time investors are aware of them, they could have already broken out to levels well above the pivot point.
Identifying stocks that are set up correctly allows the trader to be watching for such stocks before they break out. It also makes it possible to buy these stocks just as they are breaking above the pivot (on sufficient volume). It is critical to buy a stock not more than a few percent above the pivot price because, in many cases, stocks tend to pull back to and test the pivot area before continuing their advance. If a tight stop-loss? discipline is followed, the trader who chases a stock too far above the pivot point is likely to get stopped out on a subsequent pullback to, or just below, the pivot point.
AN IDEAL
Figure 1 shows an idealized cup-with-handle structure, including both its daily closing price and volume characteristics. Following an advance, point A identifies the start of the left side of the cup. The price then falls, begins building a base, and trades essentially sideways until reaching point B, which is the end of the bottom of the cup. It then begins to rise on increasing volume until hitting resistance at the pivot point C, completing the cup.

FIGURE 1: CUP-WITH-HANDLE. An idealized cup-with-handle pattern, showing two possible buy points and their stop-loss levels.
As the price pulls back under the resistance, and must do so on
decreasing volume, a proper handle forms on the right side of the cup between
points C and D. After point D, the price finally begins its breakout run.
At point E a position may be taken, just as the price exceeds the pivot
price on sufficient volume. If the position is not taken until point F,
and a suitable stop-loss level established, the trader may be stopped out
on a subsequent pullback at point G and miss a dramatic advance.
...Continued in the September 2001 issue of Technical Analysis of STOCKS & COMMODITIES
Rick Martinelli and Barry Hyman are with Haiku Laboratories, a software development company that provides a screening service for the cup-with-handle pattern. They may be reached at info@haikulabs.com.
Excerpted from an article originally published in the September 2001 issue of Technical Analysis of STOCKS & COMMODITIES magazine. All rights reserved. © Copyright 2001, Technical Analysis, Inc.
Return to September 2001 Contents