TRADING TECHNIQUES
Incorporate Another Dimension Into Price Patterns
Hidden Rewards Of Cycles
by Mohab Nabil, MSTA
Head and shoulders patterns appear frequently in price charts. By using simple cyclical analysis you can forecast not only the price target, but also when that price will be reached.
Making a profit in the stock market is all about timing. Despite this, many investors and analysts still do not treat the dimension of time with the consideration it is due. The timing factor, along with risk and reward, should be sufficiently weighted when trading a specific pattern. To say that the reward-risk ratio of a given trade is 3:1 is not completely accurate; this is because the time frame in question has not been taken into account, and the time frame may make all the difference whether you make three points or lose one point.
To trade profitably, you need to project the amount of time it will take for the price to reach its expected target. By doing so, you will be able to handle money management techniques in a more proficient way and identify patterns that generate fast or slow price movements.
I will describe how to incorporate simple cycle analysis into price patterns and identify head and shoulders formations. This will enable you to determine approximately when price targets will be reached, which in turn will help you construct a reward-risk-time ratio.
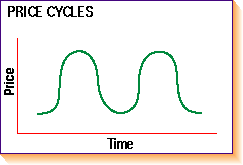
FIGURE 1: The vertical measurement of each cycle or its height is referred to as the amplitude. The horizontal axis measures the time or duration of each cycle, measured from bottom to bottom.
JUST WHAT ARE CYCLES?
A price cycle can be defined as a recognizable price pattern that occurs
with some degree of regularity. Figure 1 displays the appearance of such
a cycle. A market with a 13-week cycle, for example, is one that has a
tendency to bottom every 13 weeks. The following terms are commonly associated
with cycles:
- Commonality - Summed cycles are a common factor among different stocks and commodities. Cycles exist in the price action of all stocks, and the cyclical component in each issue can be expected to have a similar duration.
- Proportionality - There is a proportional relationship between cycles. Longer cycles have larger amplitudes than cycles with shorter durations. For example, a 13-week cycle will have a larger amplitude than a five-week one.
- Summation - Price action is nothing but the summation of different cycles with different durations and amplitudes.
- Variation - Cycles are just strong tendencies but can be subject to changes or variation. When a stock typically has a 10-week cycle, but for some reason shows a three-week cycle, this three-week cycle should be expressed as a variation of the 10-week cycle.
...Continued in the September 2001 issue of Technical Analysis of STOCKS
& COMMODITIES
Mohab Nabil is currently working as chief technical analyst for Investia Holdings for Financial Investments in Cairo, Egypt. He has published articles on technical analysis for both Egyptian magazines and international journals. After working hours, he trades the US equity markets and carries out his own research. His main focus is pattern recognition and cyclic analysis. He can be reached at mohab12@yahoo.com.
Excerpted from an article originally published in the September 2001 issue of Technical Analysis of STOCKS & COMMODITIES magazine. All rights reserved. © Copyright 2001, Technical Analysis, Inc.
Return to September 2001 Contents