You can copy these formulas and programs for easy use in your spreadsheet or analysis software. Simply "select" the desired text by highlighting as you would in any word processing program, then use your standard key command for copy or choose "copy" from the browser menu. The copied text can then be "pasted" into any open spreadsheet or other software by selecting an insertion point and executing a paste command. By toggling back and forth between an application window and the open Web page, data can be transferred with ease.
This month's tips include formulas and programs for:
or return to September 2001 Contents
![]() NEUROSHELL TRADER: CANDLECODE
NEUROSHELL TRADER: CANDLECODE
Viktor Likhovidov's CandleCode trading systems, described in "Light Up Your Trading System With CandleCode Trading" elsewhere in this issue, can easily be implemented in the NeuroShell Trader Trading Strategy Wizard by inserting Likhovidov's rules into the correct places.
Using the indicators we created for the March 2001 issue of STOCKS & COMMODITIES (which can be found at the NeuroShell Trader free technical support website in the STOCKS & COMMODITIES section), we can recreate the two systems that Likhovidov describes in his article with the following steps.
Detecting Turning Points (Figure 1)
To insert the strategy:
1. Select Insert - New Trading Strategywhere:
2. On the Long Entry Tab - insert the condition - CrossOver Above(X, Y)
3. On the Short Entry Tab - insert the condition - CrossOver Below(X, Z)
X = Avg(Avg(CandleCode(Open, High, Low, Close), 21), 3)
Y = 50
Z = 70
FIGURE 1: NEUROSHELL TRADER, TURNING POINTS CANDLECODE SYSTEM. Here is Viktor Likhovidov's CandleCode trading system to detect turning points, as implemented in NeuroShell Trader.
The numbers above are just examples for the parameters. You can
use different values if you desire.
Moving Averages and Bollinger Bands (Figure 2)
To insert the strategy:where:
1. Select Insert -New Trading Strategy
2. On the Long Entry Tab - insert the condition - CrossOver Above (X, Y)
3. On the Short Entry Tab - insert the condition - CrossOver Below(X, Z)
X = Avg(Avg(CandleCode(Open, High, Low, Close), 21), 3)
Y = BBLow(Avg(Avg(CandleCode(Open, High, Low, Close), 21), 3),20,2)
Z = BBHigh(Avg(Avg(CandleCode(Open, High, Low, Close), 21), 3),20,2)
Again, the numbers above are just examples for the parameters. You
can use different values if you desire.
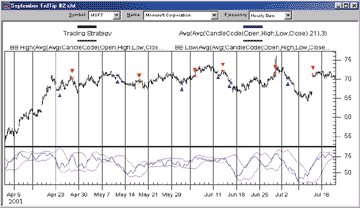
If you have NeuroShell Trader Professional or NeuroShell DayTrader Professional, you can use our genetic algorithm optimizer to determine the best values for any or all of the parameters (as suggested by Likhovidov).FIGURE 2: NEUROSHELL TRADER, MOVING AVERAGES AND BOLLINGER BANDS CANDLECODE SYSTEM. Here is Viktor Likhovidov's CandleCode system based on moving averages and Bollinger Bands, as implemented in NeuroShell Trader.
We've created both of the CandleCode trading systems for you. They can be downloaded from the NeuroShell Trader free technical support website. In addition, if you place the provided charts in your template directory, you can apply this system to any new chart that you create.
Users of NeuroShell Trader can go to the STOCKS & COMMODITIES section of the NeuroShell Trader free technical support website to download a copy of current and past Traders' Tips.
-- Marge Sherald, Ward Systems Group, Inc.
301 662-7950, sales@wardsystems.com
https://www.neuroshell.com
![]() NEUROSHELL TRADER: MAMA
NEUROSHELL TRADER: MAMA
John Ehlers's MESA adaptive moving average (MAMA), presented in his
article in this issue, can be easily implemented in NeuroShell Trader (Figure
3) by using NeuroShell Trader's ability to call external Dynamic Linked
Libraries.
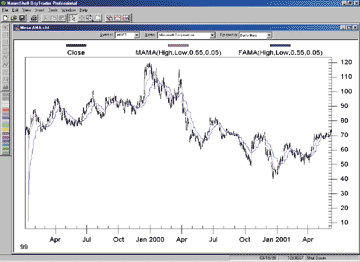
FIGURE 3: NEUROSHELL TRADER, MAMA. This NeuroShell Trader chart displays the MESA adaptive moving average (MAMA) and the following adaptive moving average (FAMA).
Dynamic Linked Libraries can be written in C, C++, Power Basic (also
Visual Basic using one of our add-on packages), or Delphi. For your convenience,
we've recreated the MESA adaptive moving average that you can download
from NeuroShell Trader's free technical support website. We've also provided
the code at our website in case you wish to make your own modifications
to it.
After downloading the custom indicator, you can easily insert it or combine it with any of our 800+ built-in indicators into a chart, prediction, or trading strategy.
Users of NeuroShell Trader can go to the STOCKS & COMMODITIES section of NeuroShell Trader's free technical support website to download this or any past Traders' Tip.
-- Marge Sherald, Ward Systems Group, Inc.GO BACK
301 662-7950, sales@wardsystems.com
https://www.neuroshell.com
![]() INVESTOR/RT: CANDLECODE
INVESTOR/RT: CANDLECODE
Investor/RT has added a built-in technical indicator called Candle Code.
The Investor/RT implementation of Viktor Likhovidov's CandleCode, described
in "Light Up Your Trading System With CandleCode Trading" elsewhere in
this issue, allows the user to supply weighting factors for each of the
following candle components: body color, body size, upper shadow, lower
shadow, and gap. The preferences for the Candle Code indicator can be seen
in Figure 4.
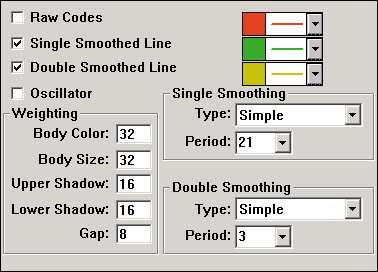
FIGURE 4: Investor/RT Candle Code indicator. This window shows the preference settings for the Investor/RT Candle Code indicator.
The weighting works as follows. In our example, let's assume the
weights were assigned as seen in the preferences shown in Figure 4: body
color(32), body size(32), upper and lower shadows(16), and gap(8). These
weights can be assigned any integer value. If the body color is white (up
candle), then a positive 32 will be added. If the body color is black (down
candle), then 32 will be subtracted from the code. If the close and open
are equal (unchanged candle), then the body color weight will have no effect
on the code. The body size component can be anywhere between -32 (for a
large down candle body) to +32 (for a large up candle body). A value of
8 would represent a relatively small up candle. The upper shadow component
only adds positive, or bullish value. If no upper shadow exists, it will
have no effect on the code. The upper shadow component may be anywhere
from 0 to 16 in our example, depending on the size of the shadow. Similarly,
the lower shadow only adds negative, or bearish value. The lower shadow
component may be anywhere from 0 to -16, depending on size of the shadow.
The gap component represents a value given to the difference between the
open and the previous close. The gap component can range from -8 to 8 in
our example, depending on the magnitude and direction of the gap.
The Candle Code can be charted as raw data, smoothed, double-smoothed,
and/or drawn as an oscillator representing the difference between the single-
and double-smoothed lines. In the chart in Figure 5, the top pane depicts
three-minute candles of Csco. The second pane shows the raw Candle Code
data. The third pane shows the smoothed and double-smoothed lines using
the preferences from Figure 4. The fourth pane shows an oscillator representing
the difference between the single- and double-smoothed lines. All lines,
bars, and histograms can be dragged and dropped between panes, and overlaid
using single or multiple scaling.
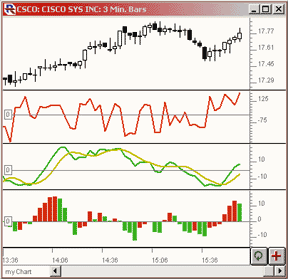
FIGURE 5: Investor/RT Candle Code indicator. This Investor/RT candlestick chart plots the Investor/RT Candle Code indicator three different ways.
From testing a small sample of three-minute data, the double-smoothed
line appears to give strong leading signals when changing slope in extreme
positive or negative territory, or when the oscillator crosses the zero
reference line.
The Candle Code oscillator can be referenced in the Rtl language as
"CCOSC." The scan syntax for a Candle Code buy signal would be as follows:
CCOSC >= 0 AND CCOSC.1 < 0
The scan syntax for a Candle Code sell signal would be as follows:
CCOSC <= 0 AND CCOSC.1 > 0
The Ccosc token can be used in creating automated scans, custom
indicators, or trading signals for backtesting.
-- Chad Payne, Linn Software, Inc.
800 546-6842, info@linnsoft.com
https://www.linnsoft.com
![]() INVESTOR/RT: MAMA
INVESTOR/RT: MAMA
In "MESA Adaptive Moving Averages" in this issue, John Ehlers combines maximum entropy spectral analysis with the Hilbert transform to form a moving average that adapts to price movement. This MESA adaptive moving average, or MAMA, has now been added to Investor/RT as a built-in technical indicator.
MAMA can be drawn as either a histogram oscillator depicting the difference
between the MAMA and FAMA lines, or as individual MAMA and FAMA lines.
Figure 6 shows the preferences available for MAMA.
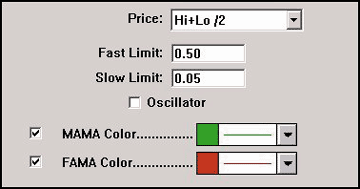
FIGURE 6: INVESTOR/RT, MAMA. MAMA can be drawn in Investor/RT as either a histogram oscillator depicting the difference between the MAMA and FAMA lines or as individual MAMA and FAMA lines. The preferences available for MAMA are shown here.
When the oscillator checkbox is unchecked, you have the option of
showing either the MAMA line or the FAMA line, or both. Figure 7 illustrates
the use of both the oscillator and the individual lines. The upper pane
shows the MAMA and FAMA lines overlaying the daily bars of Rnwk. The MAMA
line is drawn in green while the FAMA line is drawn in red. The lower pane
depicts the oscillator, drawn as a histogram. The histogram bars represent
the difference between the MAMA line and the FAMA line. The histogram color
represents whether the bar was an up bar (green) or a down bar (red).
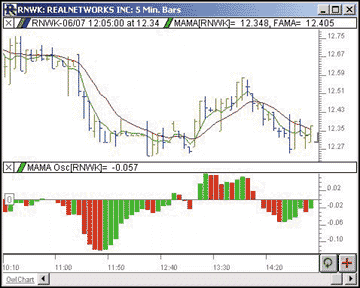
This MESA adaptive moving average has also been added to the Investor/RT RTL Language and has been assigned the token name MAMA. RTL can be used to compose scans, custom indicators, backtest trading signals, annotations, and e-mail alerts.FIGURE 7: INVESTOR/RT, MAMA. The upper pane shows the MAMA and FAMA lines overlaying the daily bars of RNWK. The MAMA line is drawn in green while the FAMA line is drawn in red. The lower pane depicts the oscillator, drawn as a histogram. The histogram bars represent the difference between the MAMA line and the FAMA line. The histogram color represents whether the bar was an up bar (green) or a down bar (red).
-- Chad Payne, Linn Software, Inc.
800 546-6842, sales@linnsoft.com
https://www.linnsoft.com
![]() WEALTH-LAB.com: CandleCode
WEALTH-LAB.com: CandleCode
In "Light Up Your Trading System With CandleCode Trading" in this issue, Viktor Likhovidov presents the latest installment in his series of STOCKS & COMMODITIES articles on coding candlesticks. Likhovidov presents a trading system based on double-smoothed CandleCode penetrating upper and lower Bollinger Bands.
We've implemented Likhovidov's system in Wealth-Lab and posted it (with some small modifications) at the Wealth-Lab.com website. Here, we'll share some of the system-testing results. The first modification we made was to eliminate the short positions, as these consistently reduced the system's performance on stocks in our backtesting. We also increased the Bollinger Band standard deviations to 2.0. This decreases the system's exposure but the gives the trades that are generated a higher probability of profit.
We then created a WatchList of 12 randomly selected Nasdaq 100 stocks and ran a three-year simulation using Wealth-Lab's $imulator tool. We established a starting account equity of $50,000 and a base position size of $5,000.
The full $imulation results are reported in Figure 8. The bottom line: The system did well, returning 100.1% net profit over the historical period (Figure 9). This didn't beat the buy-and-hold return of 145.75%, but the system was able to achieve its profit with far less market exposure -- only 32.8%.
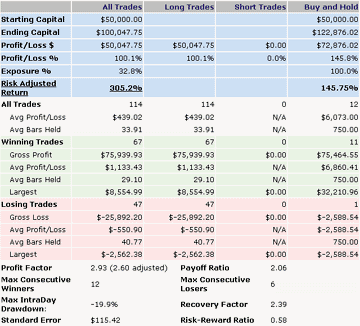
FIGURE 8: WEALTH-LAB, CANDLECODE SYSTEM RESULTS. Here are the results from running a three-year simulation of Likhovidov's CandleCode system against 12 randomly selected Nasdaq 100 stocks using Wealth-Lab's $imulator tool. The equity plot is shown in Figure 9.
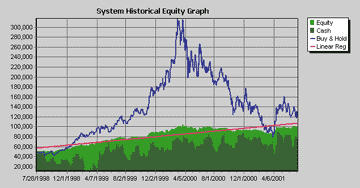
FIGURE 9: WEALTH-LAB, CANDLECODE SYSTEM. Likhovidov's CandleCode system did well, returning 100.1% net profit over the historical period.
To locate the CandleCode II ChartScript on the Wealth-Lab website,
click the ChartScripts main menu heading, then the "Search" link.
Search for ChartScripts with "CandleCode" in their title.
-- Dion Kurczek, Wealth-Lab, Inc.GO BACK
773 883-9047, dionkk@ix.netcom.com
https://www.wealth-lab.com
![]() TECHNIFILTER
PLUS: CANDLECODE
TECHNIFILTER
PLUS: CANDLECODE
Here is a TechniFilter Plus formula that computes Viktor Likhovidov's CandleCode indicator described in "Light Up Your Trading System With CandleCode Trading" in this issue.
Formula for CandleCode
NAME: CandleCode
SWITCHES: multiline
FORMULA: [1]: (C-O)U0 {body}
[2]: H - (C%O) {UpperShadow}
[3]: (C#O) - L {LowerShadow}
[4]: [1]X55 - .5*[1]|55 {ThBot_Body}
[5]: [1]X55 + .5*[1]|55 {ThTop_Body}
[6]: [2]X55 - .5*[2]|55 {ThBot_LS}
[7]: [2]X55 + .5*[2]|55 {ThTop_LS}
[8]: [3]X55 - .5*[3]|55 {ThBot_US}
[9]: [3]X55 + .5*[3]|55 {ThTop_US}
[10]: (C>=O) * 64 {ColorCode}
[11]: (C>=0) * (([1]<[4])*16 + (T=0) * ([1]<[7])*32 + (T=0) * 48) {BodyCodePos}
[12]: (C<0) * (([1]=0)*48 + (T=0) * ([1]<[4])*32 + (T=0) * ([1]<[5])*16) {BodyCodeNeg}
[13]: [11] + [12] {BodyCode}
[14]: ([2]<>0) * ( ([2]<[8]) * 4 + (T=0) * ([2]<[9])*8 + (T=0) *12 )  {USCode}
[15]: ([3]=0) * 3 + (T=0) * ([3]<[6]) * 2 + (T=0) * ([3]<[7])*1 {LSCode}
[16]: [10] + [13] + [14] + [15] {CandleCode}
The next set of code illustrates a TechniFilter Plus strategy that
implements Likhovidov's trading system that uses a moving average of this
CandleCode calculation (MaCC) as the basis for signals. The strategy reverses
from short to long when the MaCC breaks up across the lower Bollinger Band,
where the band calculation is on MaCC instead of the normal close. The
strategy reverses from long to short on a down cross of the top band.
TechniFilter Plus Strategy that trades on the cross of the MaCC and
Bollinger Bands on the MaCC
FORMULAS-----------------
[1] Date
[2] CandleCode
CandleCode()
[3] MaCC(45)
[2]X&1X3
[4] CrossLong(13,1.2)
([3] - ([3]X&1 - &2 * [3]|&1))U2-TY1
[5] CrossShort(13, 1.5)
([3] - ([3]X&1 + &2 * [3]|&1))U2-TY1
RULES-----------------
r1: EnterLong
reverse short to long 1 on Close
at signal: EnterLong [4]=1
r2: EnterShort
reverse long to short 1 on Close
at signal: EnterShort [5]=-1
Visit RTR's website to download this formula as well as program updates.
-- Clay Burch, Rtr SoftwareGO BACK
919 856-9600, rtrsoft@aol.com
https://www.rtrsoftware.com
![]() TRADING SOLUTIONS: CANDLECODE
TRADING SOLUTIONS: CANDLECODE
The trading systems described in Viktor Likhovidov's article, "Light Up Your Trading System With CandleCode Trading," as well as the functions from his March 2001 S&C article, "Coding Candlesticks (II)," can be reproduced in TradingSolutions fairly easily. The MetaStock Indicator Builder language used in the articles' examples is very similar to that of TradingSolutions.
Here are the underlying functions from the original article as coded for TradingSolutions:
CandleCode Value: Body
CandleBody ( Open , Close )
Abs ( Sub ( Open , Close ) )
CandleCode Value: Lower Shadow
CandleLower ( Low , Open , Close )
Sub ( Min ( Open , Close ) , Low )
CandleCode Value: Upper Shadow
CandleUpper ( High , Open , Close )
Sub ( High , Max ( Open , Close ) )
The threshold functions from Likhovidov's March 2001 article can be simplified into two functions:
CandleCode Threshold: Bottom
CThreshBot ( Data )
BBandBottom ( Data , 55 , 0.5 )
CandleCode Threshold: Top
CThreshTop ( Data )
BBandTop ( Data , 55 , 0.5 )
Here are the CandleCode functions from Likhovidov's March 2001 article:
CandleCode Step: Body
CCodeBody ( High , Low , Open , Close )
If ( EQ ( Close , Open ) , If ( GE ( CandleUpper
( High , Open , Close ) , CandleLower ( Low , Open , Close ) ) , 64 , 48
) , If ( GT ( Close , Open ) , If ( LE ( CandleBody ( Open , Close ) ,
CThreshBot ( CandleBody ( Open , Close ) ) ) , 80 , If ( LE ( CandleBody
( Open , Close ) , CThreshTop ( CandleBody ( Open , Close ) ) ) , 96 ,
112 ) ) , If ( LE ( CandleBody ( Open , Close ) , CThreshBot ( CandleBody
( Open , Close ) ) ) , 32 , If ( LE ( CandleBody ( Open , Close )
, CThreshTop ( CandleBody ( Open , Close ) ) ) , 16 ,0 ) ) ) )
CandleCode Step: Lower Shadow
CCodeLower ( Low , Open , Close )
If ( LE ( CandleLower ( Low , Open , Close )
, 0 ) , 3 , If ( LE ( CandleLower ( Low , Open , Close ) , CThreshBot (
CandleLower ( Low , Open , Close ) ) ) , 2 ,If ( LE ( CandleLower ( Low
, Open , Close ) , CThreshTop ( CandleLower ( Low , Open , Close ) ) )
, 1 , 0 ) ) )
CandleCode Step: Upper Shadow
CCodeUpper ( High , Open , Close )
If ( LE ( CandleUpper ( High , Open , Close )
, 0 ) , 0 , If ( LE ( CandleUpper ( High , Open , Close ) , CThreshBot
( CandleUpper ( High , Open , Close ) ) ) , 4 , If ( LE ( CandleUpper (
High , Open , Close ) , CThreshTop ( CandleUpper ( High , Open , Close
) ) ) , 8 , 12 ) ) )
CandleCode
CCode ( High , Low , Open , Close )
Add3 ( CCodeBody ( High , Low , Open , Close
) , CCodeLower ( Low , Open , Close ) , CCodeUpper ( High , Open , Close
) )
Meanwhile, Likhovidov's article in this issue introduces two entry/exit systems based on the CandleCode function -- one based on crossing thresholds and one based on Bollinger Bands (Figure 10).
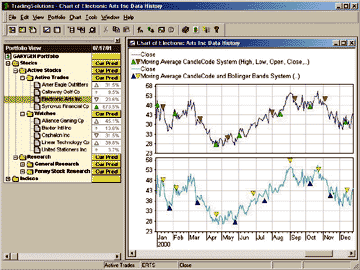
FIGURE 10: TradingSolutions, CandleCode. Here's a chart of Likhovidov's two CandleCode systems as implemented in TradingSolutions.
Both systems rely on the following smoothed version of the CandleCode:
Moving Average CandleCode
MaCC ( High , Low , Open , Close , Period )
EMA (EMA (CCode ( High , Low , Open , Close ) , Period ) ,3 )
Moving Average CandleCode System
Inputs: High, Low, Open, Close, MA Period, Upper Level, Lower Level
Enter Long:
CrossAbove ( MaCC ( High, Low, Open, Close, MA Period ) , Lower Level
)
Enter Short:
CrossBelow ( MaCC ( High, Low, Open, Close, MA Period ) , Upper Level
)
Moving Average CandleCode and Bollinger Bands
Inputs: High, Low, Open, Close, MA Period, Band Period, Top
Deviations, Bottom Deviations
Enter Long:
CrossAbove ( MaCC ( High, Low, Open, Close, MA Period ) , BBandBottom
(MaCC ( High, Low, Open, Close, MA Period ) , Band Period , Bottom Deviations
) )
Enter Short:
CrossBelow ( MaCC ( High, Low, Open, Close, MA Period ) , BBandTop
(MaCC ( High, Low, Open, Close, MA Period ) , Band Period , Top Deviations
) )
All these TradingSolutions functions and systems are available in a function file that can be downloaded from the Solution Library section of our website. They can then be imported into TradingSolutions using "Import Functions..." from the File menu.
To apply one of these imported systems to a stock or group of stocks, select "Add New Field..." from the context menu for the stock or group, select "Apply an entry/exit system to generate an entry/exit signal," then select the desired entry/exit system from the "Traders Tips Systems" group.
-- Gary Geniesse
NeuroDimension, Inc.
800 634-3327, 352 377-5144
info@tradingsolutions.com www.tradingsolutions.com
![]() BYTE INTO THE MARKET: MAMA
BYTE INTO THE MARKET: MAMA
The Byte Into The Market formula for computing the MESA adaptive moving
average (MAMA) from John Ehlers's article in this issue is shown in Figure
11. To chart the following adaptive moving average (FAMA), simply replace
MAMA on the last line of the formula with FAMA.
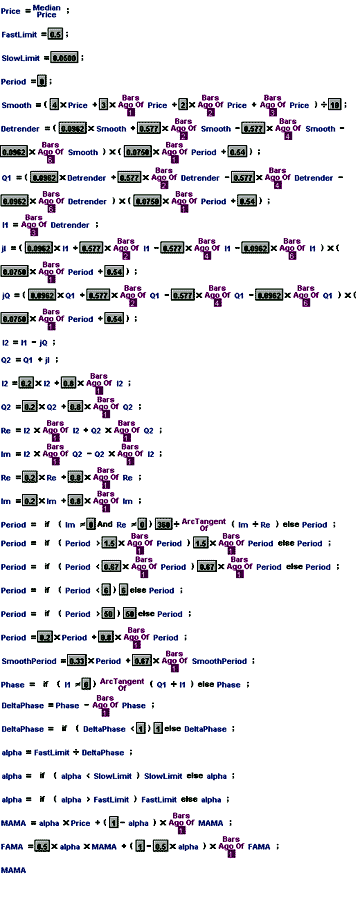
FIGURE 11: BYTE INTO THE MARKET, MAMA. Here is the Byte Into The Market formula for computing John Ehlers's MESA adaptive moving average (MAMA). To chart the FAMA, simply replace MAMA on the last line of the formula with FAMA.
This formula is also available in a downloadable zip file from our
website at https://www.tarnsoft.com/mama.zip.
-- Tom Kohl, Tarn Software
https://www.tarnsoft.com
303 794-4184, bitm@tarnsoft.com
All rights reserved. © Copyright 2001, Technical Analysis, Inc.