CHARTING
Chart Pattern Failures Are Among The Most Reliable Signals
Winning With Failures
by Christopher Narcouzi
Believe it or not, you can take advantage of failed patterns and profit handsomely.
Have you ever bought a stock after it broke through the resistance line, only to see the price drop a few days later? Have you ever bought into a breakout from a reverse head and shoulders pattern, just to watch that breakout fail a few days later? If you had placed a stop, as recommended, your position would have closed out. But you don't have to stop there. Instead, close your position and trade the stock in the opposite direction.
Patterns form because the market expends effort to create a pattern that explains price direction. Ideally, the activity on a price chart after a pattern has started should confirm the continuation of the pattern. But if you trade chart patterns the way I do, you know that they often don't continue as expected. When this happens, it means that the market refused to follow through and thus should be traded in the opposite direction. Jack Schwager, in his Schwager On Futures: Technical Analysis, states that a failed signal is among the most reliable of all chart signals. In the examples that follow, you'll see the strength of his statement.
SUPPORT AND RESISTANCE LEVELS
Usually, when a stock price breaks above a resistance level, several new long positions will open in the hope that price will continue trending upward. However, instead of prices continuing as expected, there can be an abrupt price reversal and the prices will plummet. This is known as a bull trap.
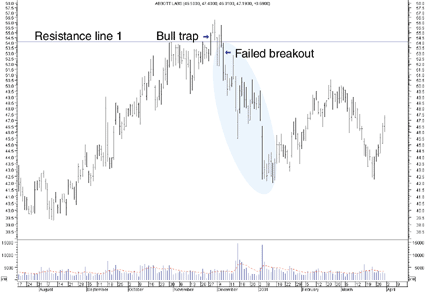
An example can be seen in Figure 1. Abbott Laboratories [ABT] broke out above resistance line 1 on November 28, 2000. Almost 12 million shares were traded when the price drifted above this resistance line. New long positions found the breakout to be attractive and bought shares, raising prices further.

FIGURE 1: Bull trap. Prices broke above the resistance level, only to drift back below it. All long positions would have been trapped but by closing their long positions and entering new short positions, they would have had significant profits.
Unfortunately, these new shareholders were trapped on December 6, 2000, when ABT closed below resistance line 1. If you had placed a stop on your long trade, which should have been just below the resistance level, your trade would have been stopped out. The tendency among less experienced traders would be to move on to another security after being stopped out. Instead of doing so, you might consider going short. In such a case, you could have ridden the stock down from $54 to $42, getting a return of 28.5% over a one-month period.
When prices break out below the support level, it will attract new shorts.
At times, it can be followed by prices moving sharply higher contrary to
what is expected - that is, prices continuing down. This is known as a
bear trap, an example of which can be seen in Figure 2. When prices of
AFLAC, Inc. [AFL], broke below support line 1, it attracted many shorts.
Almost 28 million shares were traded while the price was below the support
line. But on March 15, 2000, these new shorts were trapped when AFL closed
above support line 1. If you had shorted AFL after it closed below the
support line, you should cover your short position at this point and enter
a long position. The small loss you would have incurred if you had closed
your position would have easily been made up by your new long position.
...Continued in the November 2001 issue of Technical Analysis of STOCKS & COMMODITIES.
Christopher Narcouzi is a systems programmer and UNIX system administrator
with 18 years' experience in data processing and a BS in computer science.
He uses a sector investing strategy along with intermarket analysis, economy
timing, and candlestick charts. He can be reached at chnarcouz@mediaone.net.
Excerpted from an article originally published in the November 2001 issue of Technical Analysis of STOCKS & COMMODITIES magazine. All rights reserved. © Copyright 2001, Technical Analysis, Inc.