CYCLES
The Secrets Of Cycles And What They Can Reveal
What Can Market Cycles Tell Us?
by Tim W. Wood, CPA
Everything in nature moves in cycles - the solar system, the migration of geese, sleep patterns. Of more immediate interest to traders are cycles in the agricultural and financial markets. Cycle analysis is the one approach that can provide relatively accurate time and price projections.
Usually, the effect of cycles is of only passing interest to market analysts and traders, unless the cycles in question are related to market prices and can be used to identify tops and bottoms of price movement and give indications of future price activity. That is the challenge the cycle analyst faces.
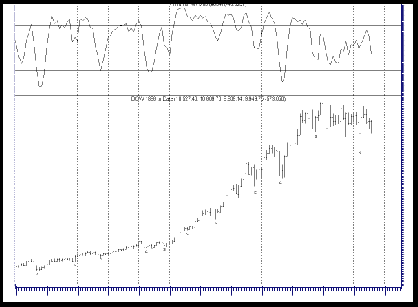
Cycle analysis of the futures markets assumes that at any given time, current fundamental information is relative only to the current price structure, and that fundamental events will occur to move prices in the direction of the cycle. Such an event might be a government report that greatly changes the supply or demand picture; money supply figures; utterances of Federal Reserve officials; foreign purchases; crop failures or freezes in any part of the world; war or the threat of war; or unexpected political action such as embargoes, tariffs, or price controls. These and many other unforeseen factors can alter prospects for the future. But cycles can contract, expand, and even skip a beat now and then. Oscillator/cycle combinations such as those introduced by Walter Bressert are powerful tools that often allow for early identification of cycle highs and lows. In the chart of the Dow Jones Industrial Average (DJIA) displayed in Figure 1, the difference between the five-period and three-period Williams' %R oscillator is used to detect cycle tops and bottoms. Once a high/low has been identified, the component parts of the cycle are used to set up time expectations for the next high or low.

FIGURE 1: Dow Jones Industrial Average (1990- august 2001). The four-year cycle lows are denoted by "4," and "S" denotes seasonal cycle lows. The oscillator moves below the 65 level on all four-year lows.
HAS THE FOUR-YEAR CYCLE TOPPED?
The last four-year cycle closing low occurred in October 1998 at 969 for the Standard & Poor's 500, and in September 1998 at 7615 on the DJIA. The analysis of the DJIA can be seen in Figure 1. As of August 2001, the top of the current four-year cycle could have occurred in March 2000 at 1535 on the S&P 500 and in January 2000 at 11723 on the DJIA. If the four-year cycle has indeed topped, this means that the count from the 1998 lows to the potential top would be 17 months for the S&P and 16 months for the DJIA. Going back to 1896 and looking at the four-year cycle in the DJIA, the four-year cycle has topped five times in 20 months or less. As is evident from Figure 2, every four-year cycle that has topped in 20 months or less has always taken out the previous four-year cycle low.
In analyzing the five times that this has happened, I noticed that the
percent decline from the four-year cycle highs to the lows were as follows:
46% from the 1901 high of 78 to the 1903 low of 42; 44% from the 1912 high
of 94 to the 1914 low of 53; 86% from the 1930 high of 294 to the 1932
low of 41; 40% from the 1939 high of 156 to the 1942 low of 93; and 16%
from the 1948 high of 193 to the 1949 low of 162. The average decline of
these five cycles is 46%. If the current cycle retraced 86%, this would
put the DJIA at 1641 and the S&P 500 at 214. A 40% decline would put
the DJIA at 7034 and the S&P at 921. A 16% decline would put the DJIA
at 9847 and the S&P at 1289. A 46% decline would put the DJIA at 6330
and the S&P at 829.
...Continued in the November 2001 issue of Technical Analysis of STOCKS & COMMODITIES.
Tim Wood has been working with cycles and trading the markets for about a decade. He is a licensed certified public accountant and an affiliate member of the Market Technicians Association. He can be reached at cyclesman@jam.rr.com.
Excerpted from an article originally published in the November 2001 issue of Technical Analysis of STOCKS & COMMODITIES magazine. All rights reserved. © Copyright 2001, Technical Analysis, Inc.