![]()
Trading Uncertainty
It's tempting to use investment information providers during an unstable market. But traders, be wary: sometimes there is as much uncertainty in the services you receive as in the market itself.
As a trader, you may find yourself searching for ways to get that extra edge over the growing uncertainty in the market. One increasingly popular method is through investment information providers. You've probably seen these services in a variety of different forms - newsletters, web posts, e-mails. Investment information services use different analytical techniques to evaluate stocks, and select those that appear the most profitable. Every service has its own methods, but all aim to do the same thing: give you accurate and timely predictions. Most services also accommodate a variety of different trades - short, long, swing, and so forth.
With the numerous providers out there, finding one that can really help you may be a challenge. There are several important things you should remember when choosing an investment information service. While the service's fee is a factor, their methods and the depth of their research are also critical. Check the backgrounds and experience of their analysts. Experienced researchers can make all the difference to a provider in much the same way that the quality of managers do to their funds. In addition, you should be able to access the performance record of the managers. When you see a high success rate, check the way it's being calculated. (A success rate can change drastically, depending on if it's calculated on an end-total basis or as an on-average basis.)
Trade10 (www.trade10.com) and Xvestor (www.xvestor.com) are examples of two Internet-based investment information providers. For more sites, check previous Stocks & Commodities service listings.
TRADE 10
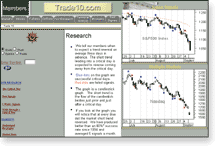
Trade10"s research is based on what is referred to as a "critical
day." According to Trade10, the critical day is the expectation of
a reversal of the short-term trend. This means that whatever the current
short trend, a pivot point will occur on the critical day, and the security
will trend in the opposite direction. On a candlestick chart, successful
critical days will be a series of peaks or troughs in the short-term market.
Normally, Trade10 warns traders of a reversal of the short trend three
days in advance. This gives traders ample time to adjust their strategy
to the given signal. Critical days are generated about five times a month;
their analysis is applied to trading stocks, options, futures, and some
index mutual funds.

Trade10's research relies on a mixture of technical analysis, fundamentals, and market indicators to produce pivot points for likely trend reversals.
Trade10's research relies on a mixture of technical analysis, fundamentals, and market indicators to produce pivot points for likely trend reversals, and the developers claim an 80% success rate in producing accurate critical days. Their website shows a series of candlestick charts of indexes and securities with pivot points highlighted in blue or red. These colored points display the correct (blue) and incorrect (red) critical day predictions. You can also see their archives for critical-day signals. These signals start back in 1994, and continue on a monthly basis to the present. The website also provides a walkthrough of a critical day. Here, you can follow their analysis of technical, fundamental, and supply-and-demand indicators to identify potential critical days. Trade10 notes that failed critical days can be as helpful as successful ones, because they often represent a stronger bias (than expected) of the current trend. Traders can then use that information accordingly.
Trade10 is also a good aid for those doing their own research. It provides reference to dozens of technical indicators, a glossary of futures and options terms, and articles on fundamentals and technical analysis. You can also read the releases of the most current market information from the Federal Reserve and the Bureau of Labor Statistics.
If you would like to subscribe to Trade10, you can do so from the website. Once a member, you can access reports online for critical day signals.
XVESTOR
Xvestor provides trade information based on Xreports and Xnotes. Xreports
are lists of current and closed positions in Xvestor"s portfolio.
They are sent out right before the market opens and include a market summary,
as well as possible additions to the portfolio. Xreports help members track
Xvestor's portfolio holdings and the status of each holding (whether
it is a buy or a sell, and so forth). The report also includes detailed
information, such as the date the security was bought, average price of
the holding, the percentage of gain or loss, point gain/loss, and an activity
history of each holding.

Xvestor provides trade information based on Xreports and Xnotes. Xreports are lists of current and closed positions in Xvestor's portfolio. They are sent out right before the market opens.
Xnotes provide members with recommendations. They are sent out via e-mail when warranted during the market hours. Xnotes complement Xreports, providing timely suggestions and tracking the intraday market dynamics. Samples of both can be found on the Xvestor website. For 2000 and 2001, there are monthly performance summaries, and a range of performance statistics, such as the total percent gain, average percent gain, total point gain, and average point gain. They also show the process for each calculation. For instance, the total percent gain is found by adding all the percentage gains and percentage losses of all closed positions. Average point gain, however, is calculated by taking the total point gain (computed much like the percentage) and dividing it by the number of closed positions.
Xvestor has few ready-reference resources on its site, but it includes links to other sites with more. The site is mostly focused on the service and membership subscription. It lists frequently asked questions about the Xvestor portfolio and membership benefits helpful for potential customers. It also offers an introductory rate for the first month of membership.
While by no means a sure thing, information providers can often give
you one advantage - time. The time you are free from that extra researching
is time you can use for more profitable trades. Remember to be cautious
when seeking a provider. Sites that provide performance history, research
models, and performance calculations can greatly reduce your chance of
being whipsawed by providers - or the market. - Amy Wu
AlphaTrade.com
Vancouver, BC-based AlphaTrade.com provides real-time streaming quotes at an affordable price. The base fee is $17 per month with additional fees for data from each exchange, including Canadian exchanges. For example, to receive Nasdaq Levels I and II and Nyse quotes, it will cost you an additional $11 (Nasdaq Level I is included in the Level II fee), with a fee of $1 per month for credit card charging, for a total of $29 per month.
The first striking feature about the AlphaTrade website is that it is multilingual. The menu lists seven languages, but in fact, 22 are supported. The second feature - and it"s almost unnoticeable - is that only a 19.2k modem is required. What this means is that you can use a portable PC with an antenna connection for a wireless cellphone and have Level II data on your screen - and in 22 different languages. It seems ironic that as AlphaTrade has steadily increased its capabilities and business, its stock has been victim to the tech stock bust in the Nasdaq market.
What do you get with AlphaTrade.com in terms of charts, news, and portfolio management? Let's take a look.
QUOTE INTERFACES
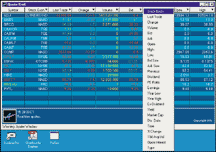
To see quotes from multiple exchanges, AlphaTrade offers a Quote Grid
that allows the selection of 26 different data options using a drop-down
menu (Figure 1). Besides stock exchange quotes, OPRA (Options Prices Reporting
Authority) quotes are also available. Getting an option symbol is accomplished
by using the option chain interface, which provides the familiar table
of calls and put strike prices for expiration months. Entering an option
symbol in either the quote or portfolio window uses OPRA for a best price
option quote. The exchange providing the option quote is shown if "exchange"
is one of the 26 data options you have chosen. If news has become available
on one of your Quote Grid stocks, a red asterisk appears. Comtex is used
for news headlines and stories.

FIGURE 1: Level I Quote Grid with Drop-Down Menu. Each of AlphaTrade's screens is a separate configurable window. Twenty-six different data options are available for viewing and sorting on the quote window. The quote screen also indicates if there has been a news event.
The user interface for Level II data is typical of many sites; it provides Level I information at the top of the window and then columns of data for the market maker ID, time, ask and bid prices, and sizes, with color-coding and arrows to show price movement and the inside bid and ask. A color band shows the size of bids and asks. Transaction summary shows the last 200 transactions for time and sales. Each equity has its own configurable window. You can also have a ticker window with your stocks.
CHARTING
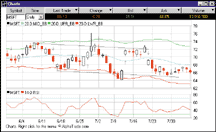
Daily, weekly, and intraday (one, five, 15, and 60 minutes) charts (Figure
2) come with the choice of 18 analysis techniques, all of which have been
taken from Technical Analysis From A To Z by Steven Achelis of Equis
International. This alleviates any problems with not knowing the definitions
of the various techniques. Price data can be plotted using OHLC, HLC, candlestick,
high bar, close line, dots, performance, and relative performance. Analysis
techniques, such as Bollinger Bands, are overlaid on price, but those requiring
their own scaling system replace the volume chart. Thus, you are limited
to two charts, with as many overlays as you might want for the price chart,
as long as the price scale is not affected. You can annotate either chart
with multiple trends and adjust the trendlines by moving either end up
or down or stretching, or shift the entire trendline. In addition, the
charts are offered in three different color schemes.

FIGURE 2: Microsoft, Daily Chart. This daily chart of Microsoft shows AlphaTrade's enhanced color scheme. Volume, the normal default for the second chart, has been replaced by RSI (relative strength index). Expansion and contraction of the time scale is accomplished by clicking on a small plus or minus at the bottom lower right of the window. Zoom in or out using a menu option. Multiple trendlines can be attached.
OTHER FEATURES
You can also select a "most active" window, which gives you the option of the usual most active candidates, such as percentage gainers and losers, dollar gainers and losers, and volume from US and Canadian exchanges (Figure 3). The Snap Quote feature displays a quote along with fundamental information such as market capitalization and price/earnings ratio. The portfolio manager allows you to see each of your holdings but cannot accommodate short positions.

FIGURE 3: Most active window. You can select from the usual candidates for most active such as volume, price, or percentage gainers/losers from both the US and Canadian exchanges.
SUMMARY
AlphaTrade provides real-time streaming quotes for both stocks and options
at a reasonable price. The analysis tools are balanced between price and
volume indicators but are limited in number. Near-term plans are to include
multiple simple and exponential moving averages, which AlphaTrade expects
to have available by September. Intraday charts are limited to data of
one day, but again, near-term plans are to provide up to 10 days of intraday
history. There is no export capability for Bridge data. The screens available
for use are the ones you would expect - namely, a quote grid, charting,
a Nasdaq Level II quote screen, a portfolio manager, most actives, and
a news source. The additions are the ticker and snap quote. The system
requirements are minimal, allowing hosting on a number of PC platforms.
If the Palm Pilot supported Java, AlphaTrade would likely be compatible.
Overall, for the price, it's a competitive package.
- Dennis D. Peterson, Staff Writer
Originally published in the November 2001 issue of Technical Analysis of STOCKS & COMMODITIES magazine. All rights reserved. © Copyright 2001, Technical Analysis, Inc.