BASIC TECHNIQUES
A Refresher In Stochastics And The Relative Strength Index
Threshold Trading Revisited
by Rudy Teseo
An introduction for newcomers or a refresher for oldtimers: Here are a couple of tools we sometimes forget to use.
In trading jargon, the "threshold" refers to the presignal area of overbought/oversold indicators - the area above or below the limits set in threshold-crossing indicators. The relative strength index (RSI) and stochastics are probably the best-known threshold-crossing indicators and are great for creating entry and exit trading signals. The presignal areas - the "thresholds" - are useful for knowing when to act, whether you're buying or selling.
THE TWO FRIENDS: RSI AND STOCHASTICS
The relative strength index (RSI), developed by J. Welles Wilder, is
a single-component oscillator that ranges between zero and 100%. This oscillator
actually measures the ratio of recent upward price changes to downward
price changes within the same security over a specified period, which Wilder
defined as 14. Since then other periods have been suggested - mainly three,
nine, and 25. When the up and down movements are equal, the RSI is at 50%.
When U>D, the indicator will be somewhere between 50% and 100%. When
U Stochastics is an overbought/oversold indicator, developed by George
Lane. This oscillator also ranges from zero to 100%. It compares the latest
closing price to the price range over some past period, which Lane suggested
be set between five and 21. The stochastic is a two-component indicator.
The main component is called %K and the second component (which is an average
of %K) is called %D. The %K is usually shown as a solid line and the %D
as a dashed line, and in most programs they are displayed as different
colors. When the closing price is equal to the midpoint of the period's range,
%K will be at 50%. When the closing price is above the range's midpoint,
%K will be somewhere between 50% and 100%. When it is below, %K will be
between 50% and zero. In addition to moving above and below the threshold
in the stochastic oscillator, the movements of %K and %D with respect to
each other can also be used as signals. Wilder defined 30 and 70 as the oversold and overbought thresholds,
respectively. Lane defined his thresholds as 20 and 80. These values are
critical in signaling that extreme prices are being reached, a feature
that may not be too apparent on price charts. Extremes are defined as new
highs or new lows. In addition to extremes, you can use these indicators
to spot divergences between prices and the indicator. However, this feature
is not relevant in the presignal discussion. When either indicator falls below the lower threshold, it is considered
an oversold condition. When indicators rise above the upper threshold,
they indicate an overbought condition. Both areas then become presignal
areas - meaning you are ready to cross the threshold. When is anyone's
guess. If the indicator is in the lower threshold it will eventually rise,
signaling a buying opportunity. However, it might stay in this area for
a long time, and you don't want to buy prematurely. Similarly, if the indicator
is in the upper threshold, it will eventually move below, signaling a sell.
Again, the indicator may remain there for some time or go even higher,
and you don't want to sell too soon. ...Continued in the December 2001 issue of Technical Analysis of
STOCKS & COMMODITIES

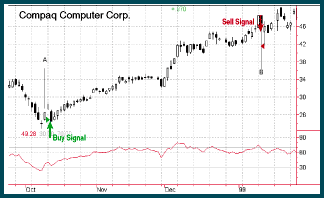
FIGURE 1: COMPAQ CORP. [CPQ]. Here, you see the entry and exit signals based on the RSI crossing above 30 and below 70.
Excerpted from an article originally published in the December 2001 issue of Technical Analysis of STOCKS & COMMODITIES magazine. All rights reserved. © Copyright 2001, Technical Analysis, Inc.