Pure stock market technicians ignore fundamentals. To them, the chart tells the whole story, while the fundamentals are distracting and misleading. Pure fundamental analysts, on the other hand, ignore price action. Here's a method that synthesizes the best of both: converting a fundamental variable -- the interest rate-adjusted earnings yield on the Standard & Poor's 500 index -- into a technical indicator to maximize risk-adjusted returns.
VALUATION
Most technicians view price relative to a derivative of price, such as a moving average. The objective is either to identify a trend or identify periods when the market is extremely overbought or oversold. However, all of these approaches suffer from a common problem: Viewing price in a vacuum may completely disconnect it from any underlying reality. This happened during the Internet stock bubble of 2000, for example, when so many momentum players rode the trend that it took on a life of its own.
The fault of many pure fundamentalists is the opposite: in an often vain attempt to peg an "appropriate" valuation level on stocks, they may buy or sell prematurely. For example, until 1959, the dividend yield on the S&P 500 was an excellent gauge of market value. Whenever the yield on the S&P 500 dropped below that of high-grade corporate bonds, the stock market was overvalued and tended to fall. A profitable strategy was to sell stocks when the dividend yield dropped below the bond yield and buy when the dividend yield rose again.
In 1959, however, the dividend yield on the S&P 500 dropped below that of corporate bonds and has been below it ever since. If you had exited the S&P 500 in 1959, you would have underperformed the market by a wide margin. Similarly, those who followed the dividend yield or the earnings yield (one divided by the more familiar price-earnings ratio) would have exited stocks somewhere in the early 1990s, missing out on the bulk of one of the greatest bull markets in history.
CONSTANT FLUX
This doesn't mean fundamentals are useless, but traditional valuation measures must be put in perspective. Fundamental analysts spend a great deal of time trying to determine the appropriate level of the market. Their method is based on the concept that when you buy a stock, you are purchasing a claim on the future earnings of a company. Therefore, the price of a stock should bear some relationship to the earnings of the underlying company. In the same way, the price level of the index should be related in some way to the aggregate earnings of the companies making up the index.
The problem, of course, is that investors change their minds frequently and dramatically about how much they are willing to pay for a dollar of earnings, past or present. They may do this for several reasons:
1. Concerns about the ability of the company to continue to generate earnings in the future
2. Concerns about inflation (which will erode the present value of a stream of future earnings)
3. Current interest rates, which will determine how much money you could earn risk-free in Treasury bills or bonds, or
4. The risk premium assigned to stocks, or the amount of return above the risk-free instruments to compensate for the increased risk of owning stocks.
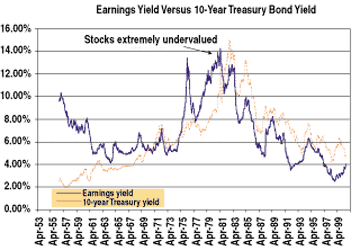
Figure 1: Earnings yield vs. 10-year Treasury bond yield (April 1953-March 2001). Earnings yield and the 10-year Treasury bond yield have tracked each other closely.
...Continued in the December 2001 issue of Technical Analysis of STOCKS
& COMMODITIES
Excerpted from an article originally published in the December 2001 issue of Technical Analysis of STOCKS & COMMODITIES magazine. All rights reserved. © Copyright 2001, Technical Analysis, Inc.
Return to December 2001 Contents