December 2001
TRADERS' TIPS
You can copy these formulas and programs for easy use in your spreadsheet or analysis software. Simply "select" the desired text by highlighting as you would in any word processing program, then use your standard key command for copy or choose "copy" from the browser menu. The copied text can then be "pasted" into any open spreadsheet or other software by selecting an insertion point and executing a paste command. By toggling back and forth between an application window and the open Web page, data can be transferred with ease.
This month's tips include formulas and programs for:
TRADESTATION: FINDING KEY REVERSALS
METASTOCK: FINDING KEY REVERSALS
METASTOCK: RSI AND STOCHASTICS
NEUROSHELL TRADER: FINDING KEY REVERSALS
NEUROSHELL TRADER: RSI AND STOCHASTICS
TRADINGSOLUTIONS: RSI AND STOCHASTICS
INVESTOR/RT: FINDING KEY REVERSALS
INVESTOR/RT: RSI AND STOCHASTICS
WEALTH-LAB: FINDING KEY REVERSALS
WEALTH-LAB: RSI AND STOCHASTICS
TECHNIFILTER PLUS: RSI AND STOCHASTICS
TECHNIFILTER PLUS: FINDING KEY REVERSALS
NEOTICKER: FINDING KEY REVERSALS
SMARTRADER: FINDING KEY REVERSALS
BYTE INTO THE MARKET: FINDING KEY REVERSALS
or return to December 2001 Contents
![]() TRADESTATION:
FINDING KEY REVERSALS
TRADESTATION:
FINDING KEY REVERSALS
Massimiliano Scorpio's article "Finding Key Reversals" in this issue includes the EasyLanguage code for a key reversal-based strategy (a trading system) that also performs some basic statistical analysis to determine how often such price patterns occur and how often they lead to profitable moves. The strategy calls a custom function for identifying key reversals, and the EasyLanguage code for that is also included in the article.
While the ideas presented are sound, there are some issues with the
code that may make it difficult to use as-is, so we are presenting an alternative
version here. The key issues are:
Strategy: Key Reversal Pattern
input: StopLossAmount( 250 ) ;
variable: KRPattern( false ) ;
KRPattern = Low < Low[1]
 and Close > Close[1]
 and Close < High ;
{ You are counting how many times the pattern recurs. INCREMENT
THE COUNT ONE BAR AFTER THE KR IS CONFIRMED. }
if KRPattern[1] then
 begin
 Value1 = Value1 + 1 ;
{ If there is a key reversal up pattern, how many times is
the following high greater or equal to the last high? }
 if High >= High[1] then
  Value2 = Value2 + 1 ;
 end ;
{ Now send the results to a text file }
if LastBarOnChart then
 begin
 Print( File( "C:\Patt.txt" ), GetSymbolName,
  "  ", ELDateToString( CurrentDate), "  Time: ",
  CurrentTime:4:0 ) ;
 Print( File( "C:\Patt.txt" ),
  "Key Reversal Up Pattern" ) ;
 if Value1 <> 0 then
  begin
  Print( File( "C:\Patt.txt" ),
   "Pattern ", Value1:4:0 ) ;
  Print( File( "C:\Patt.txt" ), "Total bars ",
   BarNumber:4:0, "  Observation on total bars ",
   Value1 / BarNumber * 100, "%" ) ;
  Print( File( "C:\Patt.txt" ),
   "Next high is greater or equal to prev high ",
   Value2:4:0, Value2 / Value1 * 100, "%" ) ;
  end ;
 end ;
{ If you want to see trading signals include the code below }
if KRPattern then
 begin
 Buy this bar on Close ;
 Sell ( "Target" ) next bar at High limit ;
 end ;
SetStopPosition ;
SetStopLoss( StopLossAmount ) ;
if BarsSinceEntry = 1 then
Sell ( "EOD" ) this bar on Close ;
This code is also available for download from www.tradestation2000i.com.
Select Support -> EasyLanguage -> Strategies and Indicators -> Traders
Tips, and look for the file "KRPatternStgy.Eld."
--Ramesh Dhingra
Director, EasyLanguage Consulting
TradeStation Technologies, Inc. (formerly Omega Research, Inc.)
a wholly owned subsidiary of TradeStation Group, Inc.
https://www.TradeStation.com
![]() METASTOCK:
FINDING KEY REVERSALS
METASTOCK:
FINDING KEY REVERSALS
Here are the MetaStock formulas for the concepts introduced in "Finding Key Reversals" by Massimiliano Scorpio elsewhere in this issue.
To identify the pattern, use the following formula in either the Expert
Advisor as a symbol/alert, in the Explorer as an exploration filter, or
in the Indicator Builder as a new indicator:
L < Ref(L,-1) AND C>Ref(C,-1) AND C < H
For the system, create a new system in the System Tester using the following formulas:
Enter Long:
 L < Ref(L,-1) AND C>Ref(C,-1) AND C < H
Close Long:
 H >=Ref(H,-1)
STOPS
----
Maximum Loss: LONG ONLY
2.0 Percent
To search a group of securities/markets for how often the pattern occurs and how profitable it is use the Explorer to create a new exploration using the following formulas:
COLUMN FORMULAS
--------------
ColumnA: # pat
 pat:=L < Ref(L,-1) AND C>Ref(C,-1) AND C < H;
 Cum(pat)
ColumnB: # bars
 Cum(1)
ColumnC: % pat
 pat:=L < Ref(L,-1) AND C>Ref(C,-1) AND C < H;
 PREC((Cum(pat)/Cum(1))*100,2)
ColumnD: # wins
 pat:=L < Ref(L,-1) AND C>Ref(C,-1) AND C < H;
 Cum(Ref(pat,-1) AND H >= Ref(H,-1))
ColumnE: % wins
 pat:=L < Ref(L,-1) AND C>Ref(C,-1) AND C < H;
 PREC((Cum(Ref(pat,-1) AND H >= Ref(H,-1))/Cum(pat))*100,2)
--Cheryl C. Abram, Equis International
www.metastock.com or www.equis.com
![]() METASTOCK:
RSI AND STOCHASTICS
METASTOCK:
RSI AND STOCHASTICS
In the article "Threshold Trading Revisited" in this issue, Rudy Teseo introduces two trading systems using RSI and stochastics.
To recreate these systems in MetaStock, select the System Tester from the Tools menu. Then click New and enter the following formulas:
RSI formulas:
Name: RSI enter long
Formula:
Ref( Cross( RSI(14), 30),-1) and H >= Ref( H, -1 )+1
Name: RSI enter short
Formula:
 Ref( Cross( 70, RSI(14)),-1) AND L <= Ref( L, -1 )-1
Stochastic formulas:
Name: Stochastic enter long
Formula:
setup:= Mov(Stoch(5,3),3,S) < 20 AND Cross(Stoch(5,3),Mov(Stoch(5,3),3,S));
Ref(setup,-1) AND H >= Ref(H,-1)+1
Name: Stochastic enter short
Formula:
setup:= Mov(Stoch(5,3),3,S) > 80 AND Cross(Mov(Stoch(5,3),3,S),Stoch(5,3));
Ref(setup,-1) AND L <= Ref(L,-1)-1
--Cheryl C. Abram, Equis International, Inc.GO BACK
www.metastock.com or www.equis.com
![]() NEUROSHELL
TRADER: FINDING KEY REVERSALS
NEUROSHELL
TRADER: FINDING KEY REVERSALS
Massimiliano Scorpio's key reversals system can be easily implemented in NeuroShell Trader's Trading Strategy Wizard by inserting his rules into the correct places.
To insert the strategy:
1. Select Insert->New Trading Strategy
2. On the Long Entry tab (Figure 1):
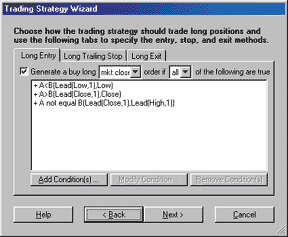
Figure 1: NEUROSHELL TRADER, KEY REVERSAL SYSTEM. Here's how to select the long entry conditions to implement the key reversal system in NeuroShell Trader.
A. Select "Generate a buy long MKT CLOSE order if ALL of the following are true"
B. Insert the condition "A<B(Lead(Low,1),Low)"
C. Insert the condition "A>B(Lead(Close,1),Close)"
D. Insert the condition "A not equal to B(Lead(Close,1), Lead(High,1))"Note: The reason we use leads here is to buy the instrument at the market close, as Scorpio suggests.
3. On the Long Trailing Stop tab (Figure 2), add the price level:
PriceFloorPnts(Trading Strategy, 1)
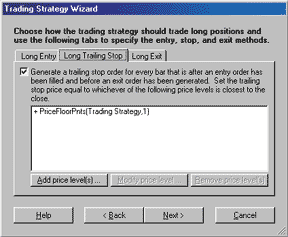
Figure 2: NEUROSHELL TRADER, KEY REVERSAL SYSTEM. Here's how to select the long trailing stop conditions to implement the key reversal system in NeuroShell Trader.
4. On the Long Exit tab (Figure 3):
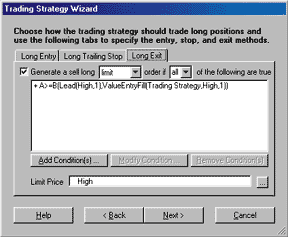
As Scorpio acknowledges in the article, it is difficult to buy exactly at the market close (which is unknown until the end of the day), so this system can only be used for backtesting. Even though Scorpio describes this system as an end-of-day system, it should probably be implemented using an intraday chart so that the values can be calculated on the fly and decisions can be made in real time (such as buying near the end of the day). This can be done using NeuroShell DayTrader Professional. Furthermore, an advantage of NeuroShell is that neural nets can be used to predict today's close.Figure 3: NEUROSHELL TRADER, KEY REVERSAL SYSTEM. Here's how to select the long exit conditions in NeuroShell Trader. A. Select "Generate a sell long LIMIT order if ALL of the following are true"
B. Insert the condition "A>=B(Lead(High, 1), ValueEntryFill(Trading Strategy, High, 1))"
C. Insert the limit price: HighNote: The reason that we use leads here is due to the presence of both stops and limits. This way, the limit is only placed when needed.
You can download the key reversal system from the NeuroShell Trader free technical support website. In addition, if you place the provided chart in your template directory, you can apply this system to any new chart you create.
Users of NeuroShell Trader can go to the STOCKS & COMMODITIES section of the NeuroShell Trader free technical support website to download a copy of this or any past Traders' Tips.
--Marge Sherald, Ward Systems Group, Inc.GO BACK
301 662-7950, sales@wardsystems.com
https://www.neuroshell.com
![]() NEUROSHELL
TRADER: RSI AND STOCHASTICS
NEUROSHELL
TRADER: RSI AND STOCHASTICS
To implement in NeuroShell Trader the RSI and stochastic systems described by Rudy Teseo in "Threshold Trading Revisited" in this issue, you must first create a NeuroShell Trading Strategy for each system.
To recreate the RSI trading system, select "New Trading Strategy ..." from the Insert menu and enter the following long and short entry conditions in the appropriate locations of the Trading Strategy Wizard (Figures 4-7):
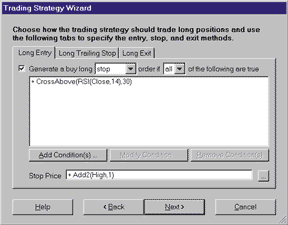
Figure 4: NEUROSHELL TRADER, RSI SYSTEM. Here's the Trading Strategy Wizard long entry tab for the RSI system.
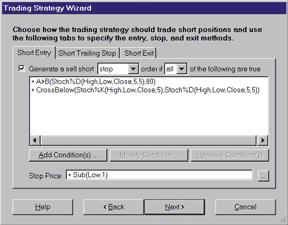
Figure 5: NEUROSHELL TRADER, RSI SYSTEM. Here's the Trading Strategy Wizard short entry tab for the RSI system.
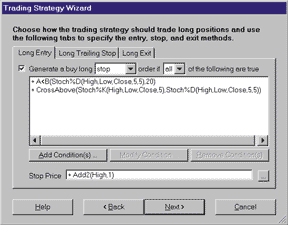
Figure 6: NEUROSHELL TRADER, STOCHASTICS SYSTEM. Here's the long entry tab for the stochastics system.
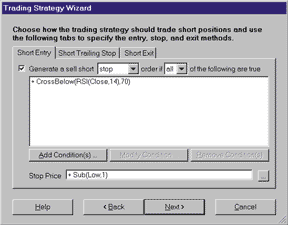
Figure 7: NEUROSHELL TRADER, STOCHASTICS SYSTEM. This screen shows the Trading Strategy Wizard short entry tab in NeuroShell Trader for the stochastics system.
Generate a buy long STOP order if all of the following are true:
Crossover Above ( RSI ( Close, 14 ), 30 )
STOP PRICE: Add2 ( High, 1 )
Generate a sell short STOP order if all of the following are true:
Crossover Below ( RSI ( Close, 14 ), 70 )
STOP PRICE: Sub ( Low, 1 )
If you have NeuroShell Trader Professional, you can also choose whether or not the system parameters should be optimized. After backtesting the trading strategy, use the "Detailed Analysis ..." button to view the backtest and trade-by-trade statistics for the Rsi system.
Next, to recreate the stochastics trading system, select "New Trading Strategy ..." from the Insert menu and enter the following long and short entry conditions in the appropriate locations of the Trading Strategy Wizard:
Generate a buy long STOP order if all of the following are true:
A<B ( Stochastic%D ( High, Low, Close, 5, 5 ), 20 )
Crossover Above ( Stochastic%K( High, Low, Close, 5 ), Stochastic%D
( High, Low, Close, 5, 5 ) )
STOP PRICE: Add2 ( High, 1 )
Generate a sell short STOP order if all of the following are true:
A>B ( Stochastic%D ( High, Low, Close, 5, 5 ), 80 )
Crossover Below ( Stochastic%K( High, Low, Close, 5 ), Stochastic%D
( High, Low, Close, 5, 5 ) )
STOP PRICE: Sub ( Low, 1 )
Once again, if you have NeuroShell Trader Professional, you can choose whether or not the system parameters should be optimized, and after backtesting, you can use the "Detailed Analysis ..." button to view the backtest and trade-by-trade statistics for the stochastics system.
Users of NeuroShell Trader can go to the Stocks & Commodities section of the NeuroShell Trader free technical support website to download the sample chart, which includes both the Rsi and stochastic trading systems.
--Marge Sherald, Ward Systems Group, Inc.
301 662-7950, sales@wardsystems.com
https://www.neuroshell.com
![]() TRADINGSOLUTIONS:
RSI AND STOCHASTICS
TRADINGSOLUTIONS:
RSI AND STOCHASTICS
The setup for the trading systems described in Rudy Teseo's article,
"Threshold Trading Revisited," can be reproduced in TradingSolutions very
easily (Figure 8). Both the RSI and stochastics are included in the provided
functions. In addition, entry/exit systems are included to check the RSI
and stochastics against thresholds.
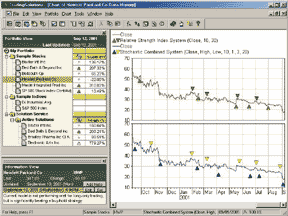
Figure 8: TradingSolutions, RSI AND STOCHASTICS. Here's a sample chart of the RSI and stochastics entry/exit systems as implemented in TradingSolutions.
The article specifies a combined method for applying stochastics
for trading. This method can be specified as an entry/exit system as follows:
Stochastic Combined System
Inputs: High, Low, Open, Close, %K Period, %K Slowing, %D Period, Threshold
Enter Long (when all of these rules are true):
1. LT ( MA (Stoch (Close, High, Low, %K Period, %K Slowing ) , %D Period), Threshold )
2. CrossAbove (Stoch (Close, High, Low, %K Period, %K Slowing ) , MA (Stoch (Close, High, Low, %K Period, %K Slowing ) , %D Period )
Enter Short (when all of these rules are true):
1. GT ( MA (Stoch (Close, High, Low, %K Period, %K Slowing ) , %D Period), Sub ( 100, Threshold ) )
2. CrossBelow (Stoch (Close, High, Low, %K Period, %K Slowing ) , MA (Stoch (Close, High, Low, %K Period, %K Slowing ) , %D Period )
Note that this system and the systems included in TradingSolutions are written to support long and short trading. For long trading only, simply sell when an Enter Short signal is generated. Also, while TradingSolutions cannot currently backtest the entry stops specified in the article, the underlying signals can easily be displayed for trading and backtested using the next day's opening price.
This system is available in a function file that can be downloaded from our website in the Solution Library section. They can then be imported into TradingSolutions using "Import Functions..." from the File menu.
It is also worth noting that stochastics often makes good inputs to neural network predictions. When using the Rsi or stochastics as inputs to predictions, you will typically want to set the preprocessing to "none," since the actual value of these functions has meaning. In addition, "change" preprocessing can be used to better identify trends.
--Gary Geniesse, NeuroDimension, Inc.
800 634-3327, 352 377-5144
https://www.tradingsolutions.com
![]() INVESTOR/RT:FINDING
KEY REVERSALS
INVESTOR/RT:FINDING
KEY REVERSALS
Investor/RT provides a comprehensive backtesting capability, which makes it easy to simulate the key reversal system described in Massimiliano Scorpio's article in this issue, "Finding Key Reversals."
First, create the following three trading signals (File: New: Trading Signal).
Name: KeyRevLong
Description: Key reversal entry signal. Also sets the custom
variable, V#1, to the previous high.
Syntax: LO < LO.1 AND CL > CL.1 AND CL < HI AND SET(V#1, HI.1)
Name: KeyRevExit
Description: Exit signal, if bar exceeded previous high.
Syntax: HI >= HI.1 AND BARSOPEN = 1
Name: KeyRevStop
Description: Stop signal, if bar did not exceed previous high.
Syntax: HI < HI.1 AND BARSOPEN = 1
Next, create a new trading system (File: New: Trading System), and add the following three rules, in this order:
If KeyRevLong then BUY $5500 at Last price
If KeyRevExit then SELL at Value V#1 price
If KeyRevStop then SELL at Close price
This backtest should be run on daily data. Click on the "Setup Backtest..."
button to specify your backtest details, such as:
- Symbol or group of symbols on which to run the backtest
- Backtesting period (number of bars on which to run the backtest)
- Maximum position sizes
- Commissions and fees
- Reporting options
Next, click the "Save System" button to save the backtest for future
reference, calling it something like "KeyReversal." Next, click the "Backtest"
button to run the backtest and view the resulting reports.
--Chad Payne, Linn SoftwareGO BACK
800-546-6842, info@linnsoft.com
www.linnsoft.com
![]() INVESTOR/RT:
RSI AND STOCHASTICS
INVESTOR/RT:
RSI AND STOCHASTICS
The Investor/RT chart in Figure 9 shows the RSI and stochastics indicators in the lower chart pane, with CSCO daily candles in the upper pane. The chart represents daily data from March 22, 2000, through August 21, 2000.
The stochastic %K is drawn in red, with the %D drawn in green. The RSI is drawn in bold blue. RSI sell signals are represented by red down arrows, while RSI buy signals are represented by blue up arrows.
Based on the threshold trading system, RSI would provide a long setup
when the RSI crosses above 30. A long entry would ensue the following day
when the price exceeded the previous high by one. This buying opportunity
can be seen on May 25 in the chart in Figure 9, denoted by the blue up
arrow. Similarly, RSI would provide a short setup when the RSI crosses
below 70. A short entry would ensue the following day when the price dropped
below the previous low by one. Two selling opportunities can be seen on
April 4 and June 23 in Figure 9, denoted by the red down arrows.
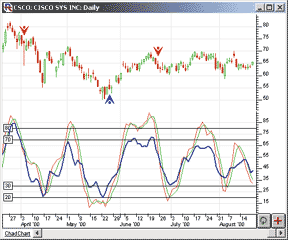
FIGURE 9: INVESTOR/RT, RSI AND STOCHASTICS. This Investor/RT chart shows the RSI and stochastics indicators in the lower chart pane, with CSCO daily candles in the upper pane. A buying opportunity can be seen on May 25, denoted by the blue up arrow. Two selling opportunities can be seen on April 4 and June 23, denoted by the red down arrows.
It's easy to view these signals historically on a daily chart, but
it is also easy with Investor/RT to monitor for these conditions on a live,
intraday basis, on a large group of securities, with scheduled scans. The
following scan would find the Rsi long condition:
RSI Long
RSI.2 <= 30 AND RSI.1 > 30 AND CL >= HI.1 + 1
This scan looks for the condition where the Rsi crossed 30 to the upside on the previous day, and the price is currently at a level at least one point higher that yesterday's high. The following scan would find the Rsi short condition:
RSI Short
RSI.2 >= 70 AND RSI.1 < 70 AND CL <= LO.1 ? 1
This scan looks for Rsi crossing 70 to the downside on the previous day, and the price currently at a level at least one point lower than yesterday's low. Both scans should be set up to run on daily data. The scans can then both be scheduled to run every 10 seconds or so. When candidates are found, Investor/RT provides the results by displaying a detailed quotepage, or by sending the results directly to a chat room, or by e-mailing the results to a group of e-mail addresses.
Briefly, scans for stochastics could be set up similarly. The syntax for the stochastics scans would be as follows:
Stochastics Long
SLOWD.2 <= 20 AND FASTD.2 <= SLOWD.2 AND FASTD.1 > SLOWD.1 AND
CL >= HI.1 + 1
Stochastics Short SLOWD.2 >= 80 AND FASTD.2 >= SLOWD.2 AND FASTD.1 < SLOWD.1 AND CL <= LO.1 - 1
Important note: The %K, as discussed in Rudy Teseo's article, is referred to as "Fast D" in Investor/RT, while the %D is referred to as "Slow D."
--Chad Payne, Linn Software
800-546-6842, info@linnsoft.com
www.linnsoft.com
![]() WEALTH-LAB: FINDING KEY REVERSALS
WEALTH-LAB: FINDING KEY REVERSALS
You can use Wealth-Lab's Scripting language, WealthScript, to perform the key reversal pattern analysis (as described elsewhere in this issue by Massimiliano Scorpio) in a way that lets you get immediate feedback as you click from symbol to symbol. Using WealthScript, you can combine trading system rules, "paint bar"-type studies, and custom commentary in a single script.
The code for the key reversal pattern analysis is presented here. The
script captures the number of pattern observations and also tracks the
success rate. It reports the information in a custom reporting pane that
is displayed under the chart (Figure 10). This script also colors key reversal
bars blue, and the ones that succeed green.
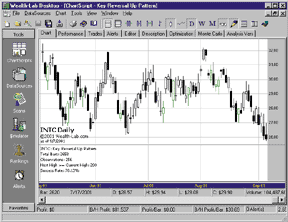
FIGURE 10: WEALTH-LAB, KEY REVERSAL SYSTEM. Here's the key reversal pattern system as implemented in Wealth-Lab.
You could take this approach further and use WealthScript's file
access functions to compile an output file based on a run through an entire
database of stocks. You could then easily import this file into Excel for
more complex analysis.
Pattern := 0;
Works := 0;
for Bar := 1 to BarCount - 2 do
begin
  if PriceLow( Bar ) < PriceLow( Bar - 1 ) then
    if PriceClose( Bar ) > PriceClose( Bar - 1 ) then
      if PriceClose( Bar ) < PriceHigh( Bar ) then
      begin
        Inc( Pattern );
        SetBarColor( Bar, #Blue );
        if PriceHigh( Bar + 1 ) >= PriceHigh( Bar ) then
        begin
          Inc( Works );
          SetBarColor( Bar, #Green );
        end;
      end;
end;
HideVolume;
ReportPane := CreatePane( 100, false, false );
DrawLabel( GetSymbol + ': Key Reversal Up Pattern', ReportPane );
DrawLabel( 'Total Bars: ' + IntToStr( BarCount ), ReportPane );
DrawLabel( 'Observations: ' + IntToStr( Pattern ), ReportPane );
if Pattern > 0 then
begin
  WinLoss := ( Works / Pattern ) * 100;
  DrawLabel( 'Next High >= Current High: ' + IntToStr( Works ),
ReportPane );
  DrawLabel( 'Success Rate: ' + FormatFloat( '#,##0.00', WinLoss ) + '%',
ReportPane );
end;
--Dion Kurczek, Wealth-Lab.com
773 883-9047, dionkk@ix.netcom.com
www.wealth-lab.com
![]() WEALTH-LAB:RSI AND STOCHASTICS
WEALTH-LAB:RSI AND STOCHASTICS
Rudy Teseo's article in this issue reviewed two of the classic technical
analysis indicators, RSI and stochastics (Figure 11). His methods
can be used as a starting point for your own trading system development.
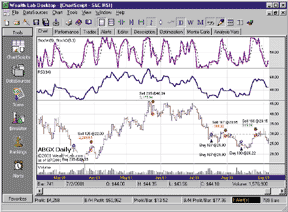
FIGURE 11: WEALTH-LAB, RSI AND STOCHASTICS. Here's the RSI and stochastics system as implemented in Wealth-Lab.
The Wealth-Lab script here incorporates the RSI and the stochastic
trading rules into a single script. This is a good example of how you can
combine different strategies into a single trading system in Wealth-Lab.
RSIPane := CreatePane( 100, true, true );
PlotSeries( RSI( #Close, 14 ), RSIPane, #Navy, #Thick );
DrawLabel( 'RSI(14)', RSIPane );
for Bar := 14 to BarCount - 1 do
begin
  if LastPositionActive then
  begin
    if CrossUnderValue( Bar, RSI( #Close, 14 ), 70 ) then
      SellAtMarket( Bar + 1, LastPosition );
  end
  else
  begin
    if CrossOverValue( Bar, RSI( #Close, 14 ), 30 ) then
      if BuyAtStop( Bar + 1, 5000, PriceHigh( Bar ) * 1.02, 'RSI' ) then
        SetPositionData( LastPosition, 1 );
  end;
end;
StochPane := CreatePane( 100, true, true );
PlotSeries( StochK( 5 ), StochPane, #Purple, #Thick );
PlotSeries( StochD( 5, 3 ), StochPane, #Black, #Dotted );
DrawLabel( 'StochK(5), StochD(5,3)', StochPane );
for Bar := 14 to BarCount - 1 do
begin
  if LastPositionActive and ( GetPositionData( LastPosition ) = 0 ) then
  begin
    if ( StochD( Bar, 5, 3 ) > 80 ) and CrossUnder( Bar, StochK( 5 ),
StochD( 5, 3 ) ) then
      SellAtMarket( Bar + 1, LastPosition );
  end
  else
  begin
    if ( StochD( Bar, 5, 3 ) < 20 ) and CrossOver( Bar, StochK( 5 ),
tochD( 5, 3 ) ) then
      BuyAtStop( Bar + 1, 5000, PriceHigh( Bar ) * 1.02, 'Stoch' );
  end;
end;
--Dion Kurczek, Wealth-Lab.com
773 883-9047, dionkk@ix.netcom.com
https://www.wealth-lab.com
![]() TECHNIFILTER PLUS: RSI AND STOCHASTICS
TECHNIFILTER PLUS: RSI AND STOCHASTICS
Here is a TechniFilter Plus strategy for the RSI strategy discussed in the threshold trading article by Rudy Teseo. The strategy sets the trigger for the long buy signal when the RSI breaks up across 30. It pulls the trigger if there is a later move of $1 or more the next day. The strategy reverses on down crosses of 70 on moves of $1 or more.
Strategy exits after opposite RSI move or 30 days.
NAME: RSI_Trigger
TEST TYPE:
DATE RANGE: all
POSITION LIMIT: 1
ENTRY FEE: 0
EXIT FEE: 0
ISSUES: c:\rtr\msdata\help\pos
FORMULAS----------------------------------
[1] Date
[2] RSI_30
 (CG14Y1 > 30) & (CG14Y2 < 30)
[3] RSI_70
 (CG14Y1 < 30) & (CG14Y2 > 70)
[4] Low-1
 LY1-1
[5] High+1
 HY1+1
[6] Low
 L
[7] High
 H
RULES----------------------------------
r1: Long
 buy long 1 on [5]
 at signal: breakUp     ([5] > [7]) & [2]
r2: Short
 open short 1 on [4]
 at signal: BreakDown     [6] < [4]
r3: Exit Long
 sell long 1 on Close
 at signal: exit     [3] ^ (EntryIndex + 30 < CurrentIndex)
r4: Exit Short
 cover short 1 on Close
 at signal: exit     [3] ^ (EntryIndex + 30 < CurrentIndex)
Visit RTR's website to download this strategy as well as program
updates.
--Clay Burch, Rtr Software
919 510-0608, rtrsoft@aol.com
www.rtrsoftware.com
![]() TECHNIFILTER PLUS: Finding KEY REVERSALS
TECHNIFILTER PLUS: Finding KEY REVERSALS
Four TechniFilter Plus formulas that implement the key reversal strategy discussed by Massimiliano Scorpio in his article, "Finding Key Reversals," are given here. The first formula returns a one on days that have a key reversal. Formula 2 returns a one when yesterday was a key reversal day and today's high is higher than yesterday's high. Formula 3 counts sell signals. Formula 4 is the percentage of key reversal days that have a higher high the next day.
Formula for marking a key reversal day
NAME: KRPattern
FORMULA: (C>CY1) & (L<LY1) & (C<H)
Formula for a sell after a key reversal day
NAME: KRPatSell
FORMULA: ((C>CY1) & (L<LY1) & (C<H))Y1 & (H>HY1)
Formula that counts sell signals
NAME: KRPatCount
FORMULA: (((C>CY1) & (L<LY1) & (C<H))Y1 & (H>HY1) )F0
Formula that gives the percentage of key reversals with a higher
high the next day
NAME: KRPatPercent
FORMULA: 100 * (((C>CY1) & (L<LY1) & (C<H))Y1 & (H>HY1) )F0
  /  ((C>CY1) & (L<LY1) & (C<H))Y1F0
Visit Rtr's website at https://www.rtrsoftware.com to download
these formulas as well as program updates.
--Clay Burch, Rtr Software
919 510-0608, rtrsoft@aol.com
www.rtrsoftware.com
![]() NEOTICKER: FINDING KEY REVERSALS
NEOTICKER: FINDING KEY REVERSALS
To implement the concept presented in "Finding Key Reversals" by Massimiliano Scorpio in NeoTicker, first create an indicator named KRPattern with two integer parameters, TME and PAT (Listing 1). Then create the testing indicator called KRPattern_Test with the same set of parameters, plus a single plot for highlighting the pattern from within a chart (Listing 2).
LISTING 1
function KRPattern()
 dim TME, PAT
' set parameters
 TME = Param1.int
 PAT = Param2.int
 ' default not found
 KRPattern = 0
 'Pattern 1 - Key Reversal Up
 if PAT = 1 then
  if (Data1.Low (TME) < Data1.Low (TME+1)) and _
   (Data1.Close (TME) > Data1.Close (TME+1)) and _
   (Data1.Close (TME) < Data1.High (TME)) then
   KRPattern = 1
  end if
 end if
end function
LISTING 2
function KRPattern_Test()
 dim TME, PAT
 ' set parameters
 TME = Param1.int
 PAT = Param2.int
 if heap.size = 0 then
  heap.allocate (2)
  heap.value (0) = 0
  heap.value (1) = 1
 end if
 ' counting how many times the pattern recurs
 Itself.MakeIndicator _
  "krp", "KRPattern", _
  Array ("1"), Array (Param1.str, Param2.str)
 if Itself.Indicator ("krp").Value (0) <> 0 then
  heap.inc (0)
  KRPattern_Test = Data1.High (0) + 1
  ' Trade.BuyAtMarket 1, ""
 else
  Itself.success = false
 end if
 ' check for following day information
 if (Itself.Indicator ("krp").Value (1) <> 0) then
  if (Data1.High (0) >= Data1.High (1)) then
   heap.inc (1)
  end if
  ' Trade.SellAtMarket 1, ""
 end if
 ' end of data reporting
 if Data1.isLastBar then
  Report.Clear ""
  Report.AddLine "", Data1.Symbol
  Report.AddLine "", "Key Reversal Up Pattern"
  Report.AddLine "", "Pattern           " + _
   tq_integer2str (heap.value (0))
  Report.AddLine "", "Total Bars        " + _
   tq_integer2str (Itself.CurrentBar (0))
  Report.AddLine "", "% Occurence       " + _
   tq_formatdouble ("0.00", _
   heap.value (0) / Itself.CurrentBar (0) * 100)
  if heap.value (0) > 0 then
   Report.AddLine "", "% Next Bar Higher " + _
   tq_formatdouble ("0.00", _
   heap.value (1) / heap.value (0) * 100)
  end if
  ' Trade.ReportTradesSummary ""
 end if
end function
The KRPattern_Test indicator will highlight the bars that meet the key reversal pattern criteria (Figure 12) as well as reporting the statistics results to an opened report window (Figure 13).
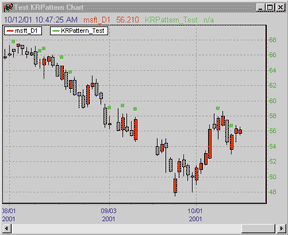
FIGURE 12: NEOTICKER, KEY REVERSAL INDICATOR. The KRPattern_Test indicator created in NeoTicker will highlight the bars that meet the key reversal pattern criteria.
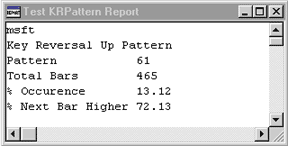
FIGURE 13: NEOTICKER, KEY REVERSAL INDICATOR. The statistical results found by the NeoTicker KRPattern_Test indicator are displayed in a report window.
If you are interested in system testing results, you can uncomment
the trade object lines to activate the trading system to see the system
performance. If you are interested in scanning for the pattern, you can
use the pattern scanner window instead of the time chart window.
A downloadable version of the indicators will be available from the TickQuest website.
--Lawrence Chan, TickQuest Inc.
www.tickquest.com
![]() SMARTRADER: FINDING KEY REVERSALS
SMARTRADER: FINDING KEY REVERSALS
Finding key reversals as described by Massimiliano Scorpio in his article in this issue is easily done in SmarTrader with one compound conditional statement. Conditions are defined in SmarTrader using the User function.
The SmarTrader specsheet for the key reversal technique is shown in
Figure 14. In row 8, Key_Rev, the three-part conditional statement is made
whereby: Low must be less than the previous Low, Close must be greater
than the previous Close, and Close must be less than High. Note that each
individual condition is enclosed in parentheses. Whenever all three conditions
are true, a value of one is returned.
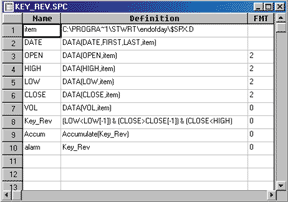
Figure 14: SMARTRADER, Key Reversals. The SmarTrader specsheet containing the formulas for the key reversal analysis is shown here.
Row 9, Accum, uses the Accumulate function to generate a count of
the ones returned when Key_Rev is true.
Row 10, Alarm, will be on if Key_Rev is on. This facilitates the use
of Smartbars in the bar chart to visually identify the occurrence of a
key reversal (Figure 15). The nature of the bar can be a different color
or different thickness if printing to a black and white printer.
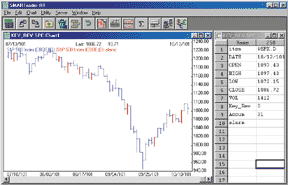
Figure 15: SMARTRADER, Key Reversals. Smartbars in the bar chart visually identify the occurrence of a key reversal. The bars can be changed to a different color or thickness if printing to a black and white printer. --Jim Ritter, Stratagem Software
504 885-7353, Stratagem1@aol.com
![]() BYTE INTO THE MARKET: FINDING KEY REVERSALS
BYTE INTO THE MARKET: FINDING KEY REVERSALS
The upward reversal pattern discussed in Massimiliano Scorpio's article
""Finding Key Reversals""" in this issue can be implemented in Byte Into
The Market. Shown in Figure 16 are the formulas for computing the percentage
of total bars on which the pattern occurs. The percentage of these reversal
pattern occurrences where the succeeding bar has a higher high is shown
in Figure 17.

FIGURE 16: BYTE INTO THE MARKET, KEY REVERSAL PATTERN. Here are the Byte Into The Market formulas for computing the percentage of total bars on which the key reversal pattern occurs.

FIGURE 17: BYTE INTO THE MARKET, KEY REVERSAL PATTERN. The percentage of these reversal pattern occurrences where the succeeding bar has a higher high is shown.
These formulas are also available in a downloadable zip file https://www.tarnsoft.com/scorpio.zip.
--Tom Kohl, Tarn Software
303 794-4184, bitm@tarnsoft.com
https://www.tarnsoft.com
TradeStation (TradeStation Technologies), MetaStock (Equis International), NeuroShell Trader (Ward Systems Group), TradingSolutions (NeuroDimension), Investor/RT (Linn Software), Wealth-Lab.com (Wealth-Lab.com), TechniFilter Plus (Rtr Software), NeoTicker (TickQuest), SmarTrader (Stratagem Software), Byte Into The Market (Tarn Software)
All rights reserved. © Copyright 2001, Technical Analysis, Inc.
Return to December 2001 Contents