INDICATORS
Something Old, Something New
Relative Vigor Index (RVI)
by John F. Ehlers
Here's an old concept brought to light using modern filters to make it a practical, useful indicator.
Since the inception of STOCKS & COMMODITIES (happy 20th anniversary year!), there have been several developments in technical analysis that have merged old concepts with new technologies. Like the magazine itself, the indicator discussed here will also be merging the old and new. The relative vigor index (RVI) uses concepts dating back to the beginning of this magazine and also uses modern filter and digital signal processing theory to realize those concepts as a practical and useful indicator.
The idea behind the RVI is basic -- prices tend to close higher than they open in up markets and close lower than they open in down markets. The vigor, or energy, of the move is thus established by where the prices end up at the close. To normalize the index to the daily trading range, divide the change of price by the maximum range of prices for the day. Thus, the basic equation for the RVI is:
RVI = (Close-Open) / (High-Low)
As you can see, the formula resembles that of an oscillator.
HISTORICAL PERSPECTIVE
In 1972, Jim Waters and Larry Williams published a description of their
accumulation/distribution oscillator. They defined buying power
(BP) and selling power (SP) as:
BP = High - Open
SP = Close - Low
in which prices were the open, high, low, and closing prices for the day. The two values, BP and SP, show the additional buying strength relative to the open and the selling strength relative to the close to obtain an implied measure of the day's trading. They combined the two and referred to it as the daily raw figure (DRF), which is calculated as:
DRF = (BP + SP)/[2*(High - Low)]
When the low of the trading day is at the open and the close is at the high, the maximum value of 1 is reached. Conversely, the minimum value of zero is reached when the market opens trading at the high and closes at the low. When you're evaluating day-to-day movement, it causes the DRF to vary radically, making it difficult to apply. This makes it necessary to smooth the results. Before doing so, however, you need to expand the equation as follows:
DRF = 1/2 [(High-Open+Close - Low) / (High-Low)]
         = 1/2 [(High-Low+Close - Open) / (High-Low)]
    = 1/2 [1+(Close-Open) / (High-Low)]
Clearly, the equation for DRF is identical to the daily RVI expression, with the only difference being the additive and multiplicative constants. However, the RVI is easier to smooth using modern filter theory. That is where modernization comes in.

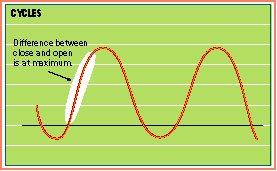
Figure 1: The difference between the close and open is at a maximum at the ascending area of the cycle.
...Continued in the January 2002 issue of Technical Analysis of STOCKS & COMMODITIES
Excerpted from an article originally published in the January 2002 issue of Technical Analysis of STOCKS & COMMODITIES magazine. All rights reserved. © Copyright 2001, Technical Analysis, Inc.
Return to January 2002 Contents