STATISTICS
Let Me Count The Days
Price Persistency
by Gordon Gustafson
Interested in measuring a short-term trend? Here's an indicator you can use.
For years, academics have made the case that price movement is random: future price changes are unrelated to past price changes. Although they are random, runs occur in any series of data. Knowing something about these runs can add valuable information to any trading program.
WHAT IS IT?
Price persistency is the number of days that a market continues to close either up or down. It's another term for a market run. As an indicator, price persistency is a measure of a very short-term trend based only on the history of the market's movement, unfiltered by any complex calculation; all it involves is counting.
To be effective, any indicator must have at least a fairly consistent correlation with whatever market you're going to trade. The advantage of price persistency is in its simplicity. The market is currently in a run or it isn't. It's either been down three days in a row or it hasn't. Of course, this is an oversimplification that ignores the magnitude of the individual changes, which can be important. But for our purposes here -- to form a trading system based on runs -- let's assume the magnitude of the changes doesn't matter.
The usefulness of price persistency is based on the theory of runs. It is the idea that, given the market has moved in a particular direction for x days, the likelihood it will either continue to do so -- or not -- can be estimated and used in a profitable trading system.
A few more assumptions must be made about price persistency in order to apply it to a market. First, in the absence of a filter, the chances of the market being either up or down must be 50%. Similarly, sequential days in the market must be unrelated. And the magnitude, or percentage of change in a day, has no effect on the existence of runs.
THEORY OF RUNS
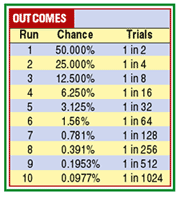
In any given series, the probability of a run can be calculated by taking the probability of one event's occurrence and multiplying it by itself as many times as we expect it to occur. For example, in a coin flip, there's a 50-50 chance of heads or tails coming up. The chance you'd get two heads in a row is (0.5)(0.5), or 25%. The probability you'd get three heads in a row is (0.5)(0.5)(0.5), or 12.5%, and so on.
This theory assumes each event is independent and one event has no influence on the next. Figure 1 displays the chance of runs occurring in any series where there are two possible outcomes with equal probability of occurrence. For instance, a run of six has about a 1.5% chance of occurring, and will probably occur once in 64 trials. Using the data of the Standard & Poor's 500 continuous futures contracts from April 27, 1988, to December 29, 1995 (the date range was selected only because it lies in about the middle of my total data), we can see the number of times that runs actually occurred in Figure 2.

Figure 1: CHANCE OF RUNS. There are two possible outcomes, each with an equal probability of occurrence.
...Continued in the January 2002 issue of Technical Analysis of STOCKS & COMMODITIES
Excerpted from an article originally published in the January 2002 issue of Technical Analysis of STOCKS & COMMODITIES magazine. All rights reserved. © Copyright 2001, Technical Analysis, Inc.