TRADING SYSTEMS
Oscillators And Trendlines
The Four Lines Trading System
by Viktor Likhovidov
Here's a simple, reliable, universal system for trading the markets.
The creation of a personal trading system requires a personal understanding of the nature of the markets and the peculiarities of market behavior. It's also critical for you to have a simple yet universal and reliable strategy from the beginning. One strategy I particularly like is based on a single indicator and includes simple but powerful statistical procedures for constructing reference lines that generate trading signals.
THE FOUR LINES
When you are using the relative strength index (RSI) - as well as many other oscillators - in trading, the rule of thumb is to sell when RSI leaves the overbought area and buy when it leaves the oversold area. The market is usually considered overbought when RSI is higher than 70 and oversold when RSI is lower than 30. But a practical application shows these generated trading signals are not reliable. After the overbought/oversold levels are broken, the chart frequently goes in the opposite direction, resulting in too large a percentage of losing positions. (For details on the RSI oscillator, see sidebar "RSI oscillator and its main properties.")
Usually, additional indicators are introduced in order to improve an RSI-based trading system. (That doesn't necessarily mean the system becomes more efficient, but it does become more complex.) It is possible, and much easier, to test and analyze a trading plan based on a single indicator.
This approach to using the RSI is based on reference levels, and the markets are too complex to adhere to them. The RSI on the hourly chart of the British pound in Figure 1 shows that within the area between the two inner lines, the value of the indicator changes for a significant period. The entire range of the RSI is limited to two parallel lines that are sloped relative to the horizontal axis. That means there are four parallel consolidation lines - the two extreme lines (upper line and lower line) that represent upper and lower bounds of the indicator, and the two inner lines (the turning lines or overbought and oversold lines) drawn through the areas where the RSI shows either up- or downturns.
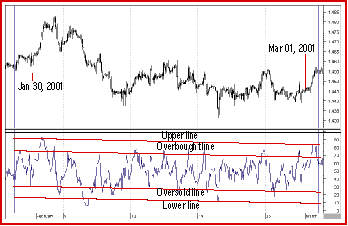
FIGURE 1: HOURLY CHART OF THE BRITISH POUND. The four lines are applied on the oscillator. The indicator oscillates between the inner lines.
The two extreme lines limit the range of RSI values. The slant of these lines is valuable information because it indicates certain changes have taken place inside the market. Range boundaries can sometimes be directed downward when the market consistently goes up, or vice versa. This suggests something is taking place inside the market that has not yet revealed itself.
...Continued in the January 2002 issue of Technical Analysis of STOCKS & COMMODITIES
Excerpted from an article originally published in the January 2002 issue of Technical Analysis of STOCKS & COMMODITIES magazine. All rights reserved. © Copyright 2001, Technical Analysis, Inc.