January 2002
TRADERS' TIPS
You can copy these formulas and programs for easy use in your spreadsheet or analysis software. Simply "select" the desired text by highlighting as you would in any word processing program, then use your standard key command for copy or choose "copy" from the browser menu. The copied text can then be "pasted" into any open spreadsheet or other software by selecting an insertion point and executing a paste command. By toggling back and forth between an application window and the open webpage, data can be transferred with ease.
This month's tips include formulas and programs for:
or return to January 2002 Contents
![]() TRADESTATION: RELATIVE VIGOR INDEX
TRADESTATION: RELATIVE VIGOR INDEX
John Ehlers's article "Relative Vigor Index (RVI)" in this issue includes a version of EasyLanguage code for the indicator. That version includes hardcoded implementations of a symmetrically weighted moving average in three places, and also a hardcoded implementation of two summations. We provide an alternative version below that replaces these hardcoded implementations with function calls. This version produces identical results, except for minor initialization differences.
The SWMA, also known as a triangular moving average, can be conveniently
implemented as a double simple moving average, and this code can be separated
out into a function that can than be called from the main body of the code
as many times as necessary. TradeStation includes a TriAverage function,
but the function required here is a little more generalized, so we call
it TriAverage_gen and provide the code for it below, following the main
indicator code. Summation is another built-in function in TradeStation,
and we use that as is.
Indicator: Relative Vigor Indexinputs:Length( 10 ) ;variables:Change( 0 ),MyRange( 0 ),Num( 0 ),Den( 0 ),RVI( 0 ),RVISig( 0 ) ;Change = Close - Open ;MyRange = High - Low ;Value1 = TriAverage_gen( Change, 4 ) ;Value2 = TriAverage_gen( MyRange, 4 ) ;Num = Summation( Value1, Length ) ;Den = Summation( Value2, Length ) ;if Den > 0 thenRVI = Num / Den ;RVISig = TriAverage_gen( RVI, 4 ) ;Plot1( RVI, "RVI" ) ;Plot2( RVISig, "Sig" ) ;Function: TriAverage_geninputs:Price( numericseries ),Length( numericsimple ) ;variables:Length1( 0 ),Length2( 0 ) ;Length1 = Floor( ( Length + 1 ) * .5 ) ;Length2 = Ceiling( ( Length + 1 ) * .5 ) ;TriAverage_gen =Average( Average( Price, Length1 ), Length2 ) ;
This code will also be available for download at www.tradestation2000i.com.
Select Support -> EasyLanguage -> Strategies and Indicators -> Traders
Tips, and look for the file "RelativeVigorIndex.ELS."
-Ramesh DhingraGO BACK
Director, EasyLanguage Consulting
TradeStation Technologies, Inc. (formerly Omega Research, Inc.)
a wholly owned subsidiary of TradeStation Group, Inc.
https://www.TradeStation.com
![]() WEALTH-LAB:
RELATIVE VIGOR INDEX
WEALTH-LAB:
RELATIVE VIGOR INDEX
Wealth-Lab Developer 2.0 contains a native implementation of the relative vigor index and a finite response filter function that you can use to produce the RVI signal line as described in John Ehlers's article this issue.
The FIR function is quite flexible and allows you to create a filter using any desired pattern of coefficients. You pass a string parameter to the FIR function that describes the coefficients that you want to apply. The RVI signal line used the values 1,2,2,1, so, in this case, you'd pass the string "1,2,2,1" to the FIR function.
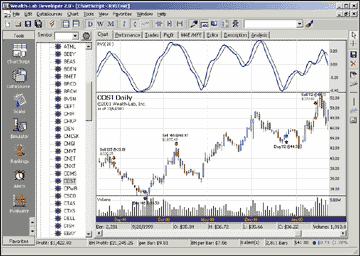
Figure 1: WEALTH-LAB, Relative Vigor Index. Here is a sample Wealth-Lab chart that implements the WealthScript for a simple trading system based on RVI/signal line crossovers.
Here is the Wealth-Lab scripting code (WealthScript) that implements
a simple trading system based on RVI/signal line crossovers. Use this as
the basis for further development and investigation of these interesting
concepts.
GO BACKvar RVIPANE, RVISER, RVISIG, BAR: integer;{ Plot RVI on the Chart }RVIPane := CreatePane( 100, true, true );RVISer := RVISeries( 10 );PlotSeries( RVISer, RVIPane, #Navy, #Thick );DrawLabel( 'RVI( 20 )', RVIPane );{ Create Signal Line using Finite Impulse Response Function }RVISig := FIRSeries( RVISer, '1,2,2,1' );PlotSeries( RVISig, RVIPane, #Black, #Thin );{ A Simple 1 Position Trading System Based on RVI/Signal Line }InstallBreakevenStop( 3 );for Bar := 15 to BarCount - 1 dobeginApplyAutoStops( Bar );if not LastPositionActive thenbeginif RVI( Bar - 1, 10 ) < -0.4 thenif CrossOver( Bar, RVISer, RVISig ) thenBuyAtMarket( Bar + 1, 'RVI Buy' );endelsebeginif RVI( Bar - 1, 10 ) > 0 thenif CrossUnder( Bar, RVISer, RVISig ) thenSellAtMarket( Bar + 1, LastPosition, 'RVI Sell' );end;end;-Dion Kurczek, Wealth-Lab.com
773 883-9047, dionkk@ix.netcom.com
www.wealth-lab.com
![]() NEOTICKER: RELATIVE VIGOR INDEX
NEOTICKER: RELATIVE VIGOR INDEX
To calculate the relative vigor index using NeoTicker, create two functions
to calculate the numerator and denominator: functions based on the four-bar
weighted single moving average (SMA) of buying power (BP) and selling power
(SP), as described in John Ehlers's article in this issue. Then create
the indicator called RVI, with two plots and a user-customizable number
of periods (Listing 1).
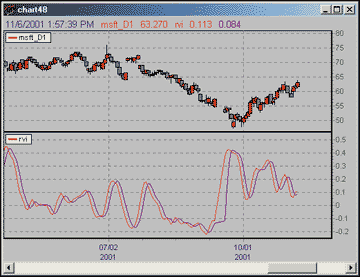
FIGURE 2: NeoTicker. Here is the RVI and the smoothed RVI in NeoTicker. The RVI indicator is an oscillator.
LISTING 1
function Value1 ( ByVal p1 )Value1 = ((Data1.Close (p1) - Data1.Open (p1)) + _2 * (Data1.Close(p1+1) - Data1.Open (p1+1)) + _2 * (Data1.Close(p1+2) - Data1.Open (p1+2)) + _(Data1.Close(p1+3) - Data1.Open (p1+3)))/6end functionfunction Value2 ( ByVal p2 )Value2 = ((Data1.High (p2) - Data1.Low (p2)) + _2 * (Data1.High (p2+1) - Data1.Low (p2+1)) + _2 * (Data1.High (p2+2) - Data1.Low (p2+2)) + _(Data1.High (p2+3) - Data1.Low (p2+3)))/6end functionfunction rvi()dim Num, Denomdim iif Data1.Valid (0) = false thenItself.SuccessEx[1] = falseItself.SuccessEx[2] = falseexit functionend iffor i = 0 to Param1.int - 1Num = Num + Value1(i)Denom = Denom + Value2(i)nextif Denom <> 0 thenItself.Plot (1) = Num/Denomend ifItself.Plot (2) = (ItSelf.Value (0) + 2 * ItSelf.Value (1) + _2 * ItSelf.Value (2) + ItSelf.Value (3))/6end function
The RVI indicator is an oscillator with two plots (Figure 4), which
shows Rvi and the smoothed Rvi .
A version of this NeoTicker RVI script is available for download at our website. Since NeoTicker EOD 2.3 does not support multiple plots, if you are interested in using the RVI with NeoTicker EOD, you can download the EOD version of RVI from our website.
-Kenneth Yuen, TickQuest Inc.GO BACK
www.tickquest.com
![]() INVESTOR/RT: RELATIVE VIGOR INDEX
INVESTOR/RT: RELATIVE VIGOR INDEX
John Ehlers's article in this issue, "Relative Vigor Index (RVI)," takes an old concept and updates it with modern filters. We have added the relative vigor index to Investor/RT as a built-in technical indicator. RVI can be drawn as either a histogram oscillator depicting the difference between the RVI and RVI signal lines, or as individual RVI and RVI signal lines. Figure 3 shows the preferences available for RVI.
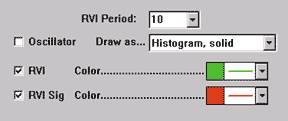
FIGURE 3: Investor/RT, Relative Vigor Index Preferences. Here are the preferences available for the RVI in Investor/RT.
When the oscillator checkbox is unchecked, you have the option of
showing either the RVI line, the RVI signal line, or both. Figure 4 illustrates
the use of both the oscillator and the individual lines. The upper pane
shows the daily bars of QQQ. The RVI line is drawn in green while the RVI
signal line is drawn in red. The lower pane depicts the Rvi and RVI signal
lines overlaying the oscillator drawn as a histogram. The histogram bars
represent the difference between the RVI line and the RVI signal line.
The histogram color represents whether the bar was an up bar (dark gray)
or a down bar (light gray). The oscillator line can be drawn as a histogram
(hollow or solid) or a line (connected or continuous).
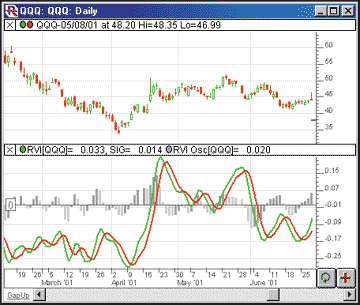
FIGURE 4: Investor/RT, Relative Vigor Index. This Investor/RT chart illustrates the use of both the oscillator and the individual lines. Displayed are the RVI, RVI signal, and in the lower window pane, the RVI oscillator.
This relative vigor index has also been added to the Investor/RT
RTL Language and assigned the token name RVI. This token gives the user
access to the RVI, RVI signal, and RVI oscillator values. RTL can be used
to compose scans, custom indicators, backtest trading signals, annotations,
and e-mail alerts.
GO BACK
-Chad Payne, Linn Software
800-546-6842, info@linnsoft.com
www.linnsoft.com
![]() SMARTRADER:
RELATIVE VIGOR INDEX
SMARTRADER:
RELATIVE VIGOR INDEX
The relative vigor index by John Ehlers is simple to implement in SmarTrader. Figure 5 gives the SmarTrader specsheet showing the formulas. Row 10, Length, is a coefficient which holds a value of 10, as defined in the article. You can change it to other values to experiment.
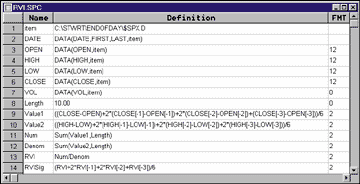
FIGURE 5: SmarTrader. Here is the SmarTrader specsheet showing the formulas for implementing John Ehlers's relative vigor index in SmarTrader.
Rows 9 and 10, Value1 and Value2, are user formula rows and duplicate
the filtering formulas from the article. Note, in SmarTrader, a minus (-)
sign is used to point backward since the absence of a sign indicates a
forward pointer.
Rows 11 and 12, Num and Denom, use the sum function and substitute for the "for" loop in the language used in the article. Any change in the value of Length will be reflected in the number of periods summed for Num and Denom.
Rows 13 and 14, RVI and RVISig, are user formula rows and duplicate the formulas in the article. Figure 6 is a sample chart of the relative vigor index in SmarTrader.
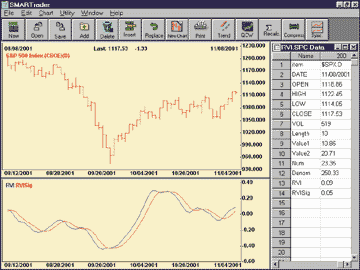
FIGURE 6: SmarTrader. Here is a sample display of the relative vigor index as plotted in SmarTrader.
-Jim Ritter, Stratagem SoftwareGO BACK
504 885-7353, Stratagem1@aol.com
![]() WAVE WI$E MARKET SPREADSHEET: RELATIVE VIGOR INDEX
WAVE WI$E MARKET SPREADSHEET: RELATIVE VIGOR INDEX
The following Wave Wi$e formulas demonstrate how to calculate some of
John Ehlers's relative vigor index. Note that Wave Wi$e uses [-n] to indicate
bars in the past; that is, [-1] is one bar ago, [-2] is two bars ago.
GO BACKA: DATE @TC2000(C:\TC2000V3\Data,DJ-30,Dow Jones Industrials,DB)B: HIGHC: LOWD: CLOSEE: OPENF: VOLG: Value1 ((CLOSE-OPEN)+2*(CLOSE[-1]-OPEN[-1])+2*(CLOSE[-2]-OPEN[-2])+(CLOSE[-3]-OPEN[-3]))/6H: Value2 ((HIGH-LOW)+2*(HIGH[-1]-LOW[-1])+2*(HIGH[-2]-LOW[-2])+(HIGH[-3]-LOW[-3]))/6I: Period 5 'Set the period lengthJ: Num @ADD(VALUE1,PERIOD)K: Denom @ADD(VALUE2,PERIOD)L: RVI @IF(DENOM<>0,NUM/DENOM)M: RVIsig (RVI+2*RVI[-1]+2*RVI[-2]+RVI[-3])/6N: chart @CHART(1)O: ' ==========End Formulas-Peter Di Girolamo, Jerome Technology
908 369-7503, jtiware@aol.com
https://members.aol.com/jtiware
![]() METASTOCK FOR WINDOWS: RELATIVE VIGOR INDEX
METASTOCK FOR WINDOWS: RELATIVE VIGOR INDEX
The Relative Vigor Index (RVI), presented by John Ehlers in his article
in this issue, can be easily recreated in MetaStock 6.52 or higher. To
recreate the RVI in MetaStock, select the Indicator Builder from the Tools
menu, then click "New" and enter the following formula:
ti:=Input("length",2,20,10);v1:=((C-O)+(2*Ref(C-O,-1))+(2*Ref(C-O,-2))+Ref(C-O,-3))/6;v2:=((H-L)+(2*Ref(H-L,-1))+(2*Ref(H-L,-2))+Ref(H-L,-3))/6;temp:=If(Sum(v2,ti)=0,0.0001,Sum(v2,ti));rv:=Sum(v1,ti)/temp;rvsig:= (rv+Ref(2*rv,-1)+Ref(2*rv,-2)+Ref(rv,-3))/6;rv;rvsig-William Golson,
Equis International, Inc.
https://www.equis.com
TradeStation (TradeStation Technologies), MetaStock (Equis International), NeuroShell Trader (Ward Systems Group), TradingSolutions (NeuroDimension), Investor/RT (Linn Software), Wealth-Lab.com (Wealth-Lab.com), TechniFilter Plus (RTR Software), NeoTicker (TickQuest), SmarTrader (Stratagem Software), Byte Into The Market (Tarn Software)
All rights reserved. © Copyright 2001, Technical Analysis, Inc.
Return to January 2002 Contents