CHARTING
Two-Day Tips
Leading Price Patterns
by Christopher Narcouzi
Cut your losses and increase your profits dramatically by using these techniques.
Oscillators provide buy and sell signals, but sometimes they can get you in late or get you out late. Signals generated by price can get you in and out earlier - a win/win situation. Here's how it works.
INSIDE DAYS
In Introduction To Technical Analysis, Martin Pring defines an inside day as a two-day pattern with the first day consisting of a fairly sharp rally and the second day's trading range completely encompassed by the first. This indicates buyers have run out of steam and are unable to push prices higher. Inside days typically occur after a persistent short-term rally. But when you see an inside day occurring, it's difficult to discern whether the move is worth acting on. To confirm, I use stochastics as a filter. I want to make sure the stock is either oversold or overbought, because only then will it result in a meaningful rally. I always trade in the direction of the trend.
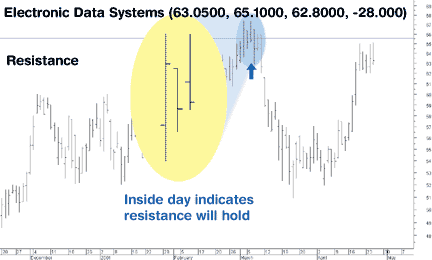
Take a look at Figure 1, and assume you have a long position in Electronic Data Systems Corp. (EDS). In early March 2001, EDS had an inside day indicating a top was near and the resistance line was going to hold. If you sold your shares at the open on the following day, you could have been filled at $65.95 per share. In this case, EDS reached a high of $67.40. You sold the stock at $1.45 below the top - not too bad.

Figure 1: Inside day. The inside day that occurred in early March is an indication a top has been reached and it's time to exit long positions.