February 2002
TRADERS' TIPS
You can copy these formulas and programs for easy use in your spreadsheet or analysis software. Simply "select" the desired text by highlighting as you would in any word processing program, then use your standard key command for copy or choose "copy" from the browser menu. The copied text can then be "pasted" into any open spreadsheet or other software by selecting an insertion point and executing a paste command. By toggling back and forth between an application window and the open Web page, data can be transferred with ease.
This month's tips include formulas and programs for:
NEUROSHELL TRADER: INSTANTANEOUS TRENDLINE WEALTH-LAB: INSTANTANEOUS TRENDLINE
![]() NEUROSHELL TRADER: INSTANTANEOUS TRENDLINE
NEUROSHELL TRADER: INSTANTANEOUS TRENDLINE
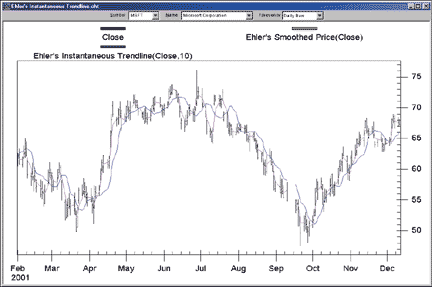
The instantaneous trendline described by John Ehlers in his article in this issue can be easily implemented in NeuroShell Trader by using NeuroShell Trader's ability to call external code segments written in traditional languages such as Basic, C, C++, and Pascal. We've created the Ehlers instantaneous trendline in a chart (Figure 1) and you can download a compiled, working version from the NeuroShell Trader free technical support website.
After installing the custom indicator, you can insert it in new charts as follows:
1. Select 'New Indicator ...' from the 'Insert' menuPlease note that in the default, we use a constant dominant cycle of 10; however, if you have Ehlers's add-on package for NeuroShell Trader, you can use the dominant cycle indicator provided. Alternatively, if you have some other method of determining the dominant cycle, you may replace the default with that indicator.
2. Select the Custom Indicator category
3. Select the Ehlers Instantaneous Trendline
4. Insert the parameters as you desire.
The Ehlers smoothed price indicator can be easily implemented in NeuroShell
Trader without writing code by combining a few of the more than 800 built-in
indicators. We've done this for you already and have created a second
custom indicator, also shown in Figure 1. Here is how we combined the built-in
indicators to implement Ehlers's smoothed price indicator in NeuroShell
Trader:
Divide(Add4(Mul2(Close,4), Mul2(Lag(Close,1),3),Mul2(Lag(Close,2),2), Lag(Close,3)) ,10)
Using the custom indicator functionality in NeuroShell Trader, we
saved it as "Ehlers Smoothed Price(Close)."

Figure 1: NEUROSHELL TRADER, INSTANTANEOUS TRENDLINE. Here's a NeuroShell Trader chart that graphically displays the Ehlers instantaneous trendline and smoothed price indicators.
After downloading the chart containing Ehlers's custom indicators,
you can easily insert the indicator in other charts or combine it with
any of our other built-in indicators.
Users of NeuroShell Trader can go to the STOCKS & COMMODITIES section
of the NeuroShell Trader free technical support website to download implementations
of this and previous Traders' Tips. For more information on NeuroShell
Trader, visit www.NeuroShell.com.
-Marge Sherald, Ward Systems Group, Inc.
301 662-7950, sales@wardsystems.com
https://www.neuroshell.com
![]() WEALTH-LAB: INSTANTANEOUS TRENDLINE
WEALTH-LAB: INSTANTANEOUS TRENDLINE
Ehlers's instantaneous trendline is available as the native WealthScript function "HTTrendLine" on both the Wealth-Lab.com website and Wealth-Lab Developer 2.0 desktop software. However, the implementation of this indicator is based on formulas that Ehlers published earlier. The updated version is available as a custom indicator that you can download into Wealth-Lab Developer 2.0 by using the program's download facility. Select "File/Download ChartScripts" from the main menu and click the "Begin download" button. This causes any newly published scripts to be downloaded directly from the Wealth-lab.com website.

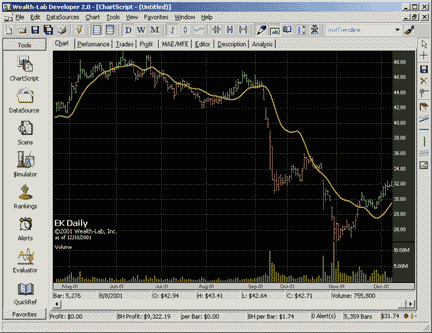
Figure 2: WEALTH-LAB, INSTANTANEOUS TRENDLINE. Here's the Ehlers instantaneous trendline as plotted in Wealth-Lab.
The following script plots the instantaneous trendline on a chart
and sets the bar colors based on whether closing prices are above or below
the trendline (see Figure 2).
var BAR: integer;{$I 'InstTrendline'}SetColorScheme( #Lime, #Red, #Olive, #Black, 021, #Silver );PlotSeries( InstTrendlineSeries( #Close ), 0, 763, #Thick );for Bar := 80 to BarCount - 1 doif PriceClose( Bar ) > InstTrendLine( Bar, #Close ) thenSetBarColor( Bar, 494 )elseSetBarColor( Bar, 944 );
-Dion Kurczek, Wealth-Lab.com
www.wealth-lab.com
All rights reserved. © Copyright 2002, Technical Analysis, Inc.
Return to February 2002 Contents