March 2002
TRADERS' TIPS
You can copy these formulas and programs for easy use in your spreadsheet or analysis software. Simply "select" the desired text by highlighting as you would in any word processing program, then use your standard key command for copy or choose "copy" from the browser menu. The copied text can then be "pasted" into any open spreadsheet or other software by selecting an insertion point and executing a paste command. By toggling back and forth between an application window and the open Web page, data can be transferred with ease.
This month's tips include formulas and programs for:
TradeStation: Trend continuation factor
Metastock: Trend continuation factor
Neuroshell Trader: Trend continuation factor
Neuroshell Trader: System debugging
Wealth-Lab: Trend continuation factor
Wealth-Lab: System debugging
NeoTicker: Trend continuation factor
NeoTicker: System debugging
Investor/RT: Trend continuation factor
BioComp Profit: Trend continuation factor
SmarTrader: System debugging
or return to March 2002 Contents
TRADESTATION: Trend continuation factor
In "Trend Continuation Factor" in this issue, M.H. Pee includes the code for a spreadsheet implementation of the TCF indicator and trading strategy. Here, we present the TradeStation EasyLanguage code for the TCF trading strategy. The strategy can easily be converted into a TradeStation indicator by replacing the buy/sell statements with plot statements as follows:
Strategy: Trend Cont Factor
inputs:
 Length( 35 ) ;
variables:
 Change( 0 ),
 PlusChange( 0 ),
 MinusChange( 0 ),
 PlusCF( 0 ),
 MinusCF( 0 ),
 PlusTCF( 0 ),
 MinusTCF( 0 ) ;
Change = Close - Close[1] ;
PlusChange = iff( Change > 0, Change, 0 ) ;
MinusChange = iff( Change < 0, -Change, 0 ) ;
PlusCF =
 iff( PlusChange = 0, 0, PlusChange + PlusCF[1] ) ;
MinusCF =
 iff( MinusChange = 0, 0, MinusChange + MinusCF[1] ) ;
PlusTCF =
 Summation( PlusChange - MinusCF, Length ) ;
MinusTCF =
 Summation( MinusChange - PlusCF, Length ) ;
if PlusTCF > 0 then
  Buy next bar at market
else if MinusTCF > 0 then
  Sell next bar at market ;
This code will be available for download from www.tradestation2000i.com.
Select Support -> EasyLanguage -> Strategies and Indicators -> Traders'
Tips, and look for the file TrendContFactor.Els.
--Ramesh Dhingra
Director, EasyLanguage Consulting
TradeStation Technologies, Inc. (formerly Omega Research, Inc.),
a wholly owned subsidiary of TradeStation Group, Inc.
https://www.TradeStation.com
METASTOCK: Trend continuation factor
In "Trend Continuation Factor" in this issue, M.H. Pee
introduces several new indicators to help identify trend and its direction.
These indicators can be easily recreated in MetaStock 6.52 or higher.
In MetaStock, select Indicator Builder from the Tools menu, click New, enter the code for the indicator, and click OK. Repeat for the remaining indicators. The code follows:
Name: +TCF
Formula:
pc:=If(ROC(C,1,$)>0,ROC(C,1,$),0);
nc:=If(ROC(C,1,$)<0,Neg(ROC(C,1,$)),0);
ncf:=If(nc=0,0,PREV+nc);
Sum(pc,35)-Sum(ncf,35)
Name: -TCF
Formula:
pc:=If(ROC(C,1,$)>0,ROC(C,1,$),0);
nc:=If(ROC(C,1,$)<0,Neg(ROC(C,1,$)),0);
pcf:=If(pc=0,0,PREV+pc);
Sum(nc,35)-Sum(pcf,35)
Name: Position
Formula:
pc:=If(ROC(C,1,$)>0,ROC(C,1,$),0);
nc:=If(ROC(C,1,$)<0,Neg(ROC(C,1,$)),0);
pcf:=If(pc=0,0,PREV+pc);
ncf:=If(nc=0,0,PREV+nc);
ptcf:=Sum(pc,35)-Sum(ncf,35);
ntcf:=Sum(nc,35)-Sum(pcf,35);
If(ptcf>0,1, If(ntcf>0,-1, PREV));
To plot the indicator, locate it in MetaStock's Indicator
Quicklist, then click and drag it onto the desired chart.
--Cheryl C. Abram, Equis International, Inc.
www.equis.com
NEUROSHELL TRADER: Trend continuation factor
To implement in NeuroShell Trader a trading system using the trend continuation
factor as described by M.H. Pee in his article in this issue, you should
first create the trend continuation indicators in a chart, then create
a NeuroShell Trader Trading Strategy based on those indicators.
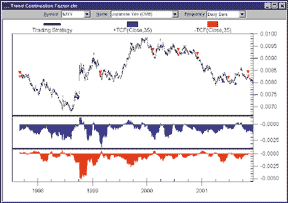
FIGURE 1: NeuroShell Trader, trend continuation factor. Here's a sample chart plotting M.H. Pee's trend continuation factor.
To create the trend continuation factor indicators, select "New
Indicator " from the Insert menu and use the Indicator Wizard to
create each of the following:
+CHANGE:
CumulativePositiveMomentum(Close,1,1)
-CHANGE:
AbsoluteValue(CumulativeNegativeMomentum(Close,1,1)
+CF:
ConsecutiveSum ( +CHANGE, A>B(+CHANGE, 0 ))
-CR:
ConsecutiveSum (-CHANGE, A>B(-CHANGE, 0 ))
+TCF:
Subtract ( Sum ( +CHANGE, 35 ), Sum ( -CF, 35 )
-TCF:
Subtract ( Sum ( -CHANGE, 35 ), Sum ( +CF, 35 )
Note: The ConsecutiveSum indicator is a custom indicator that users of NeuroShell Trader can download from the Tips & Techniques section of the NeuroShell Trader free technical support website. It is based on the following indicator with the Xs mapped to one parameter and the numeric parameters hidden:
Sub ( CumulativeSum (X,0), SelectiveMovAvg( CumulativeSum(X,0), Not(CONDITION), 1 )
To recreate the trend continuation factor trading system, select "New Trading Strategy" from the Insert menu and enter the following long and short entry conditions in the appropriate locations of the Trading Strategy Wizard:
Generate a buy long MARKET order if ALL of the following are true:
A>B ( +TCF, 0 )
Generate a sell short MARKET order if ALL of the following are true:
A<B ( -TCF, 0 )
If you have the NeuroShell Trader Professional, you can also choose
whether or not the system parameters should be optimized. After backtesting
the trading strategy, use the "Detailed Analysis" button
to view the backtest and trade-by-trade statistics for the trend continuation
factor system.
Users of NeuroShell Trader can go to the STOCKS & COMMODITIES
section of the NeuroShell Trader free technical support website to download
the sample chart that includes the ConsecutiveSum indicator, +Tcf indicator,
-Tcf indicator, and trend continuation factor trading systems. For more
on NeuroShell Trader, visit www.NeuroShell.com.
--Marge Sherald, Ward Systems Group, Inc.
301 662-7950, sales@wardsystems.com
https://www.neuroshell.com
NEUROSHELL TRADER: System debugging
The system described in John Clayburg's article in this issue,
"Debugging Your System: If At First You Don't Succeed,"
can be easily implemented in NeuroShell DayTrader Professional by creating
a NeuroShell Trading Strategy with the rules described here. We've
done this for you already and have created a chart that you can download
from the NeuroShell Trader free technical support website.
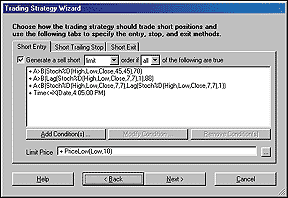
FIGURE 2: NeuroShell Trader, debugging systems. Here's how to add the short entry conditions using NeuroShell DayTrader's Trading Strategy Wizard.
However, we wanted to show you how easy it is to implement this
system in NeuroShell DayTrader Professional. To do this, select "New
Trading Strategy " (Figure 2) from the Insert menu and follow these
steps:
1. On the Short Entry Tab:
    A. Select "Generate a sell short 'LIMIT' order if 'ALL' of the following are true.
    B. Insert the conditions:
        A>B(Stoch%D(High,Low,Close,45,45),70)
        A>B(Lag(Stoch%D(High,Low,Close,7,7),1),88)
        A<B(Stoch%D(High,Low,Close,7,7), Lag(Stoch%D(High,Low,Close,7,7),1))
        Time<=X(Date,4:05:00 PM)
    C. In the Limit Price, add the indicator:
    Lowest(Low,10)
2. In the Short Exit Tab:
    A. Insert the condition
        Time>=X(Date,4:10:00 PM)
Note: Users of NeuroShell DayTrader Professional could use the genetic
algorithm optimizer to finetune these conditions for perhaps a more profitable
result.
To debug the system as suggested by Clayburg, first select the items that you are interested in seeing from the "Existing Data / Calculations" selection on the Insert menu. Second, select the "Snapshot View" from the View menu. Finally, select the "Cross Hair Cursor" from the View menu (or just select the cross hair on the toolbar). This will enable you to view any of the values on the chart by simply clicking on the date/time that you wish to see.
Note that the time of 4:10 pm was chosen for an exit because this is the next-to-last bar of the chart given the market close of 4:15 and a five-minute chart. Similarly, the time of 4:05 pm was chosen to limit the entries because 4:05 is the next prior bar given the 4:15 market close and a five-minute bar. If you apply this system to different markets or use different chart frequencies, you will need to change the times appropriately.
Users of NeuroShell DayTrader Professional can go to the STOCKS & COMMODITIES section of the NeuroShell Trader free technical support website to download an example chart with the system described in Clayburg's article.
--Marge Sherald, Ward Systems Group, Inc.GO BACK
301 662-7950, sales@wardsystems.com
https://www.neuroshell.com
Wealth-Lab: Trend continuation factor
The trend continuation factor presented by M.H. Pee in his article in
this issue is composed of two indicators, Tcf+ and Tcf-. You can install
these indicators into Wealth-Lab Developer 2.0 by using the program's
Download facility. Select "File/Download ChartScripts" from
the main menu and click the "Begin download" button. This
causes any newly published scripts to be downloaded directly from the Wealth-Lab.com
website. You can see in the download results that the TcfPlus and TcfMinus
indicators were downloaded and installed on your system (Figure 3).
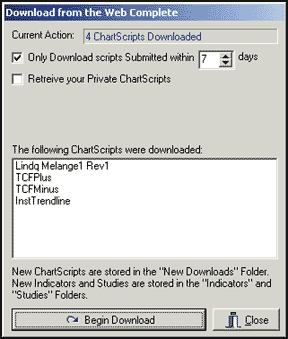
FIGURE 3: Wealth-Lab, trend continuation factor. Download the TCRPlus and TCR Minus indicators into Wealh-Lab using Wealth-Lab's download facility to download all new scripts. The results window shows what was downloaded.
You can now use these indicators in your own scripts. To include
a custom indicator or study into your script, press F6 to launch the "Include
Manager" in Wealth-Lab. Then select the indicators and/or studies
you wish to include. Here, we'll include the TcfPlus and TcfMinus
indicators, as well as the Profit Pane Study so we can see how much profit
our system is wracking up (Figure 4).
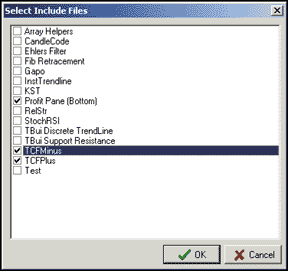
FIGURE 4: Wealth-Lab, trend continuation factor. Select the custom indicators and/or studies you wish to include in your Wealth-Lab script. The TcfPlus and TcfMinus indicators, as well as the profit pane study, were included here.
The script we present here duplicates the system rules that were
outlined in Pee's article. It is a stop-and-reverse system that
goes long when the Tcf+ crosses above zero, and sells short when Tcf- crosses
above zero. The system performed well on Ameritrade [AMTD], catching a
huge trend in late 1998 and riding it for a huge profit until June 1999.
The system equity remained flat thereafter, while AMTD experienced a marked
decline (Figure 5).
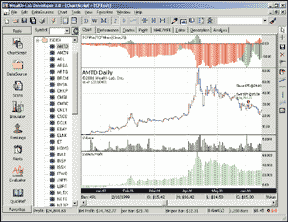
FIGURE 5: Wealth-Lab, trend continuation factor. Here are sample results from implementing M.H. Pee's stop-and-reverse system. The system performed well on Ameritrade [AMTD] in 1998-99.
var BAR: integer;
{$I 'TCFMinus'}
{$I 'TCFPlus'}
var TCFPane: integer;
TCFPane := CreatePane( 100, true, true );
PlotSeries( TCFPlusSeries( #Close, 35 ), TCFPane, 050, #ThickHist );
PlotSeries( TCFMinusSeries( #Close, 35 ), TCFPane, 900, #ThickHist );
DrawLabel( 'TCFPlus/TCFMinus(Close,35)', TCFPane );
DrawHorzLine( 0, TCFPane, #Black, #Thin );
for Bar := 36 to BarCount - 1 do
begin
 if CrossOverValue( Bar, TCFPlusSeries( #Close, 35 ), 0 ) then
 begin
  if LastPositionActive and not PositionLong( LastPosition ) then
   CoverAtMarket( Bar + 1, LastPosition, 'TCF' );
  if not LastPositionActive then
   BuyAtMarket( Bar + 1, 'TCF' );
 end
 else if CrossOverValue( Bar, TCFMinusSeries( #Close, 35 ), 0 ) then
 begin
  if LastPositionActive and PositionLong( LastPosition ) then
   SellAtMarket( Bar + 1, LastPosition, 'TCF' );
  if not LastPositionActive then
   ShortAtMarket( Bar + 1, 'TCF' );
 end;
end;
{$I 'Profit Pane (Bottom)'}
GO BACK
--Dion Kurczek, Wealth-Lab.com
www.wealth-lab.com
Wealth-Lab: System debugging
We'll compare the debugging techniques for EasyLanguage described in John Clayburg's article in this issue, "If At First You Don't Succeed," with the corresponding debugging techniques in Wealth-Lab Developer.
The first debugging tool mentioned is the print statement. This writes
a line of debugging information to the specified output device. Wealth-Lab
Developer's scripting language, WealthScript, contains a print statement
similar to EasyLanguage's. The primary difference is that you have
control of when to print. You can print only when required, so you don't
have to sort through excessive print output (Figure 6).
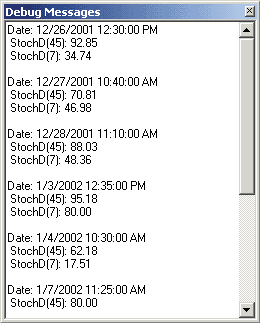
FIGURE 6: Wealth-Lab, debugging window. The print statement in Wealth-Lab Developer writes a line of debugging information to the specified output device. Wealth-Lab gives you control over what and when to print.
The next tool mentioned in the article is the Expert Commentary
window. Clayburg used the commentary window to display data values at specific
bars. While Wealth-Lab Developer does provide an expert commentary feature,
the built-in data window can be used to perform the exact same function
with no additional work. The data window automatically displays the values
for a single bar on your chart. It includes OHLC and volume, as well as
any indicators or custom series that you created in your script. As you
move the mouse over the chart, the data window updates to reflect the values
at the bar that the mouse is passing over (Figure 7).
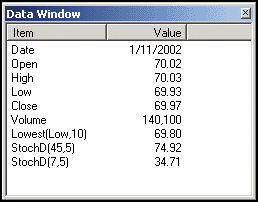
FIGURE 7: Wealth-Lab, data window. In Wealth-Lab, the data window automatically displays the values for a single bar on your chart, including OHLC and volume, as well as any indicators or custom series that you created in your script.
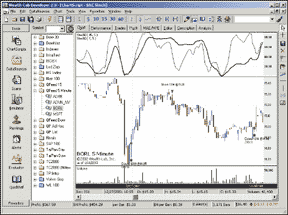
Figure 8: WEALTH-LAB, Stochastic System. Here's a sample chart of the stochastic system as implemented in Wealth-Lab.
{ Define variables }
var StochPane, Bar: integer;
var bSetup: boolean;
{ Plot indicators }
StochPane := CreatePane( 100, true, true );
PlotSeries( StochDSeries( 45, 5 ), StochPane, 202, #Thick );
DrawLabel( 'StochD( 45, 5 )', StochPane );
PlotSeries( StochDSeries( 7, 5 ), StochPane, 202, #Thin );
DrawLabel( 'StochD( 7, 5 )', StochPane );
{ Implement trading rules }
bSetup := false;
for Bar := 45 to BarCount - 1 do
begin
  if not LastPositionActive then
  begin
{ See if we have a Stochastic sell setup }
    if StochD( Bar, 45, 5 ) > 70 then
      if StochD( Bar - 1, 7, 5 ) > 88 then
        if TurnDown( Bar, StochDSeries( 7, 5 ) ) then
          bSetup := true;
{ If a sell setup is in place, sell at lowest 10 bar low stop }
    if bSetup then
    begin
      if LastBar( Bar ) then
        bSetup := false
      else if ShortAtStop( Bar + 1, Lowest( Bar, #Low, 10 ), 'Break of
Support' ) then
      begin
        Print( 'Date: ' + DateToStr( GetDate( Bar ) ) + ' ' + TimeToStr( GetTime( Bar ) ) );
        Print( ' StochD(45): ' + FormatFloat( '#0.00', StochD( Bar, 45, 5 ) ) );
        Print( ' StochD(7): ' + FormatFloat( '#0.00', StochD( Bar, 7, 5 ) ) );
        Print( '' );
        bSetup := false;
      end;
    end
  end
  else if LastBar( Bar ) then
    SellAtClose( Bar, LastPosition, 'End of Day' );
end;
--Dion Kurczek, Wealth-Lab.comGO BACK
www.wealth-lab.com
NeoTicker: Trend continuation factor
To implement in NeoTicker the trading system presented by M.H. Pee in
"Trend Continuation Factor" in this issue, first create an
indicator called Tcf with one integer parameter, Period (Listing 1). Then
create a simple backtesting system called backtestTcf with the following
attributes: initial capital: $50,000; fill: exact; size: 1; commission:
$75; multiple: 1000 (Listing 2). You will need to change the "multiple"
parameter when testing the system against different types of securities.
For example, use the setting 1,000 for crude oil, 250 for S&P index
futures, and 1 for stocks.
LISTING 1
function TCF()
   dim changeval
   if not Data1.valid (0) then
      itself.success = false
      exit function
   end if
   Period       = params(1).int
   Pchangestart = 0
   Pchangeend   = Period-1
   Nchangestart = Period
   Nchangeend   = Period*2-1
   PCFstart     = Period*2
   PCFend       = Period*3-1
   NCFstart     = Period*3
   NCFend       = Period*4-1
   ChangeIdx    = Period*4
   ' Initializing heap value
   if Heap.size = 0 then
      heap.allocate (Period*4+1)
      heap.fill 0, Period*4, 0
   end if
   itself.makeindicator "mymo", "MO", Array("1"), Array("1")
   changeval = itself.indicator("mymo")
   cidx = heap.value (ChangeIdx) mod Period
   if changeval.value (0) > 0 then
      heap.value (Pchangestart+cidx) = changeval.value (0)
      heap.value (Nchangestart+cidx) = 0
      if cidx = 0 then
         heap.value (PCFstart)       = changeval.value (0) + _
                                       heap.value(PCFend)
      else
         heap.value (PCFstart+cidx)  = changeval.value (0) + _
                                       heap.value (PCFstart+cidx-1)
      end if
      heap.value (NCFstart+cidx)     = 0
   elseif changeval.value (0) < 0 then
      heap.value (Pchangestart+cidx) = 0
      heap.value (Nchangestart+cidx) = tq_abs(changeval.value (0))
      heap.value (PCFstart+cidx)     = 0
      if cidx = 0 then
         heap.value (NCFstart)       = tq_abs(changeval.value (0)) + _
                                       heap.value(NCFend)
      else
         heap.value (NCFstart+cidx)  = tq_abs(changeval.value (0)) + _
                                       heap.value(NCFstart+cidx-1)
      end if
   else
      heap.value (Pchangestart+cidx) = 0
      heap.value (Nchangestart+cidx) = 0
      heap.value (PCFstart+cidx)     = 0
      heap.value (NCFstart+cidx)     = 0
   end if
   Heap.value(ChangeIdx) = Heap.value(ChangeIdx)+1
   if Heap.value(ChangeIdx) < Period then
      itself.success = false
      exit function
   end if
   itself.answer(1) = heap.sum (Pchangestart, Pchangeend) - _
                      heap.sum (NCFstart, NCFend)
   itself.answer(2) = heap.sum (Nchangestart, Nchangeend) - _
                      heap.sum (PCFstart, PCFend)
end function
LISTING 2
function backtestTCF ()
 'if it is first time that the function is used in a chart,
 'then the heap must be of size zero
 if heap.size = 0 then
  'now modify heap so it is no longer of size 0 and this section
  'of code will not be executed in the next round
  heap.allocate (1)
  'system setting initialization
  with trade
   .InitialCapital   = param1.real
   .commissionType   = cmFlatRate  ' cmFlatRate or cmPerUnit
   .commissionBaseAmount = param4.real ' can be a fixed value like $15
   .commissionPerUnit   = 0    ' for some brokers, can be $0.05
   .singleentryPerdirection = true
   .pricemultiple = Params(5).real
   ' if you do not want to use the system real time,
   ' change the following to false
   monitor = true
   if strcomp(param2.str, "Exact") = 0 then
    .FillType = ftExact
   elseif strcomp(param2.str, "Worst") = 0 then
    .FillType = ftWorst
   elseif strcomp(param2.str, "Average") = 0 then
    .FillType = ftAverage
   end if
  end with
 end if
 if not data1.valid (0) then
  itself.success = false
  exit function
 end if
 if not data2.valid (1, 0) or not data2.valid (2, 0) then
  itself.success = false
  exit function
 end if
 ' system rules section
 ' check if necessary to close current open position
 if data2.ValueEx (1, 0) > 0 and trade.OpenPositionSize < 0 then
  trade.exitcurrentposition ("Exit Open Position")
 end if
 if data2.ValueEx (2, 0) > 0 and trade.OpenPositionSize > 0 then
  trade.exitcurrentposition ("Exit Open Position")
 end if
 ' rules to go long
 if data2.ValueEx (1, 0) > 0 then
  trade.BuyAtMarket param3.int, "Long Entry"
 end if
 ' rules to go short
 if data2.ValueEx (2, 0) > 0 then
  trade.SellAtMarket param3.int, "Short Entry"
 end if
 ' system report at last bar -
 ' useful only during development process
 if data1.isLastBar and strcomp(Param6.str,"None") <> 0 then
  with trade
   if strcomp(Param6.str,"Report Window") = 0 then
    Report.Clear ("")
    .ReportAllTrades ("")
    .ReportTradesSummary ("")
  elseif strcomp(Param6.str,"Excel") = 0 then
    .ReportAllTrades2Excel
    .ReportTradesSummary2Excel
   end if
  end with
 end if
 backtestTCF = trade.currentequity
end function
The backtestTcf indicator will return an equity curve (Figure 9) and a
test result report. A working NeoTicker script version of this indicator
and backtest system are available for download from the NeoTicker Yahoo!
user group at: https://groups.yahoo.com/group/neoticker/.
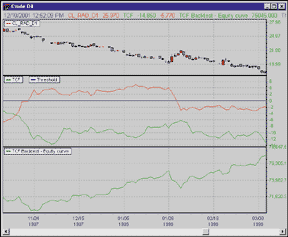
FIGURE 9: NeoTicker, trend continuation factor. The backtestTcf indicator in NeoTicker will return an equity curve and a test result report.
--Kenneth Yuen, TickQuest Inc.
www.tickquest.com
NeoTicker: System debugging
John Clayburg's article in this issue, "If At First You Don't Succeed," discusses successful methods of debugging systems to help traders who wish to create their own systems.
NeoTicker has a reporting window that allows users to send formatted
output (Figure 10). This is an excellent tool for use in debugging and
implementing trading systems. In the following NeoTicker code for implementing
Clayburg's dual stochastic system, you can use report.addline to
send to the report window the bar values of any bar (Figure 11). You can
also programmatically control report lines.
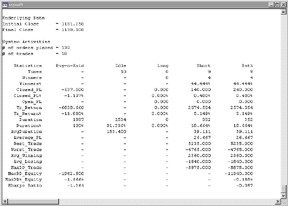
FIGURE 10: NeoTicker, system results. NeoTicker has a reporting window that allows users to send formatted output. This is a helpful tool for use in debugging and implementing trading systems.
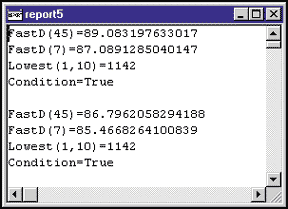
FIGURE 11: NeoTicker, Report window. In NeoTicker, you can send to the report window the bar values of any bar. You can also programmatically control report lines.
function dual_fastd()
   dim lfastd, sfastd, lowestl
   dim fastd45, fastd7, fastd71, lowestl10, condition
   if heap.size = 0 then
      heap.allocate 2 ' heap to save the condition of the current bar
      heap.value(0) = 0
      heap.value(1) = data1.day(0)
      with trade
         ' turn this option true for system monitor to track it
         .monitor = true
         ' turn this option true for real-time trading system that close
         ' all open position at end of day
         .closepositioneod = true
         ' there are 3 basic types of fill
         ' ftAverage, ftWorst, ftExact
         .fillType = ftExact
         ' commission structure (per transaction)
         ' cmFlatRate, cmPerUnit
         .commissionType = cmFlatRate
         .commissionBaseAmount = 15
         ' per unit cost setting is not important for flat rate type
         .commissionPerUnit = 0
         ' initicalcapital
         ' it is important for sharpe ratio and other
         ' performance statistics calculations only
         .initialcapital = 50000
         ' the risk free interest rate
         ' works with initial capital for statistics calculation
         .interestrate = 5
         ' pricemultiple is 1 for stock
         ' 50 for sp emini index future, 250 for sp index future
         ' 20 for nd emini index future, 100 for nd index future
         .pricemultiple = 50
         .SingleEntryPerDirection = true
      end with
   end if
   ' signal generation part
   ' construct the necessary indicators
   itself.makeindicator "lfastd", "fastd", Array ("1"), Array (params(1).str, params(2).str)
   itself.makeindicator "sfastd", "fastd", Array ("1"), Array (params(3).str, params(4).str)
   itself.makeindicator "lowestl", "llv", Array ("1.l"), Array (params(5).str)
   ' setup for the condition checking
   lfastd  = itself.indicator ("lfastd")
   sfastd  = itself.indicator ("sfastd")
   lowestl = itself.indicator ("lowestl")
   fastd45   = lfastd.value(0)
   fastd7    = sfastd.value(0)
   fastd71   = sfastd.value(1)
   lowestl10 = lowestl.value(0)
   condition = heap.value(0)
   if data1.day(0) <> heap.value(1) then
      condition     = 0
      heap.value(0) = 0
      heap.value(1) = data1.day(0)
   end if
   if trade.OpenPositionSize <> 0 then
      itself.answer(1)    = trade.currentequity
      itself.successex(2) = false
      exit function
   end if
   trade.cancelallsellorders
   ' generate orders according to the current condition
   if (fastd45 > 70) and (fastd71 >88) and (fastd7 < fastd71) then
      condition     = 1
      heap.value(0) = 1
   end if
   if data1.time(0) > TimeValue(params(7).str) then
      condition     = 0
      heap.value(0) = 0
   end if
   if condition = 1 then
      trade.sellstop lowestl10, params(6).int, otfDay, ""
      itself.answer(2) = lowestl10
      report.addline "", "FastD(45)=" + tq_double2str(fastd45)
      report.addline "", "FastD(7)="  + tq_double2str(fastd7)
      report.addline "", "Lowest(1,10)=" + tq_double2str(lowestl10)
      report.addline "", "Condition=True"
   else
      itself.successex(2) = false
   end if
   itself.answer(1) = trade.currentequity
   ' final reporting of system performance
   ' uncomment those reports that you want to output
   if data1.isLastbar then
      with trade
         '.reportalltrades ""
         .reporttradessummary ""
      end with
   end if
end function
This dual_fastd system produces two plots: the first plot is the
equity curve of your system; the second plots a dot with the lowest low
value. The preceding code will print the FastD(45), FastD(7), Lowest(1,10),
and the condition (Figure 11).
If you are interested in individual trades, you can uncomment the line reportalltrade to see the trade history of your system.
A downloadable version of this system will be available from the TickQuest website or NeoTicker user group at https://groups.yahoo.com/neoticker.
--Kenneth Yuen, TickQuest Inc.GO BACK
www.tickquest.com
Investor/RT: Trend continuation factor
Investor/RT has added a built-in technical indicator called the trend continuation factor. The preferences for the trend continuation factor indicator can be seen in Figure 12.
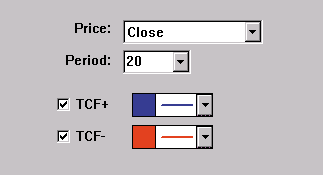
FIGURE 12: Investor/RT, preference window. Here are the suggested preference settings for the trend continuation factor.
As M.H. Pee discusses in his article in this issue, Pee created
the trend continuation factor to help identify the trend and its direction.
Positive values of either the positive trend continuation factor (Tcf+)
or the negative trend continuation factor (Tcf-) indicate the presence
of a strong trend. Positive values of Tcf+ indicate a strong uptrend, while
positive values of Tcf- indicate a strong downtrend. Tcf+ and Tcf- cannot
both be positive at the same time, since both an uptrend and a downtrend
cannot occur simultaneously. Both can be negative. If both are negative,
this signifies consolidation, or the absence of a trend. It recommended
entering long positions when the Tcf+ value is positive, and entering short
positions when the Tcf- value is negative. A daily chart of Microsoft [MSFT]
is shown below, with the trend continuation factor added to the lower windowpane
(Figure 13). Tcf+ is shown in blue, while Tcf- is show in red.
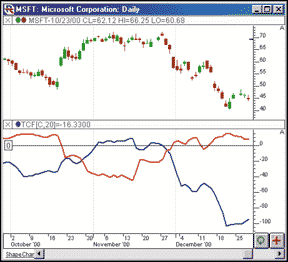
FIGURE 13: Investor/RT, trend continuation factor. This Investor/RT chart illustrates the trend continuation factor on Microsoft. The TCF+ is shown in blue, with the TCF- shown in red.
The Tcf can be created in its own windowpane, or can overlay the
price data. Tcf can be dragged back and forth between panes, or dragged
into its own pane. The indicator can be drawn showing both the Tcf+ and
Tcf- lines, or showing only one of the two. A reference line is automatically
drawn at zero. The period of the Tcf can be adjusted quickly using the
keyboard. Simply select either Tcf line (by simply clicking on it, or tabbing
to it), then hit the up or down arrows on your keyboard. The up arrow increases
the period by 1, while the down arrow decreases the period by 1. The resulting
lines will be seen instantly reflecting the change. This is a good method
for performing visual optimization while trying to determine the best period
to use for a particular market and timeframe. The trend continuation factor
is accessible to custom indicators, scans, and trading signals using the
RTL token "Tcf."
--Chad Payne, Linn Software
800 546-6842, info@linnsoft.com
www.linnsoft.com
BIOCOMP PROFIT: Trend continuation factor
This month, M.H. Pee offers us a trend continuation factor (TCF) indicator. We recreated this indicator using BioComp Profit's Indicator Add-In API and tested its performance.
To do this, we created five-, 10-, 15-, and 20-period Tcf indicators of the close of the S&P 500 continuous futures contract and used BioComp Profit's input selection, ranking, and adaptive modeling the two-day ahead change in price from August 1999 to February 2000. We then evaluated hypothetical trading from February 2000 until January 2002. Our test criterion is the ability to create hypothetically profitable trading systems on this out-of-sample data.
We found that we could create hypothetically profitable systems out-of-sample. In our test system, we realized gains of approximately $149,000 during a period where the markets declined nearly 250 points. Since these gains are achieved in a virtual model voted from a system of real models, we inspected each real model and found significant equity performance variance, indicating that a productive trading system should use additional information to increase robustness. BioComp Profit's input ranking technologies tell us that the shorter five- and 10-period Tcf offers the most useful information.
The TCF indicator add-in is freely available to all BioComp Profit users at https://www.biocompsystems.com.
--Carl Cook, President and Chief Technical OfficerGO BACK
BioComp Systems, Inc.
425 869-6770, cookcarl@biocompsystems.com
www.biocompsystems.com
SMARTrader: System debugging
Elsewhere in this issue, John Clayburg presents "Debugging Your System: If At First You Don't Succeed."
Debugging in SmarTrader RT is simple. After constructing your system
(here we use the system given in John Clayburg'sarticle), simply
minimize the chart windows and tile the spreadsheet and specification sheet
windows side by side. The rows will align and you can see the results of
the calculations, conditional statements, and so on, for every row.
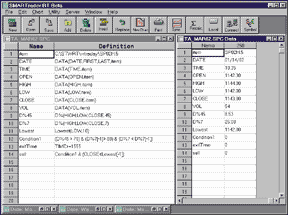
FIGURE 14: SmarTrader specsheet. Here is the SmarTrader specsheet showing how to implement the stochastics system described by John Clayburg. Tiling the specsheet and the spreadsheet side-by-side helps you debug your system.
Row 9, D%45, is the 45-bar stochastic D% calculation. Row 10, D%7,
is the seven-bar stochastic D% calculation. Note that we omit the stochastic
K, as it is not needed to calculate D%.
Row 11, Lowest, is the 10-bar lowest low.
Row 12, Condition 1, is a user row where we define the various
conditions that must occur concurrently for Condition 1 to be true.
Row 13, exitTime, is a user row where we set the exit time to
clear trades at the end of the day. Time is expressed as military time
and can be set as appropriate.
--Jim Ritter, Stratagem Software
504 885-7353, Stratagem1@aol.com
All rights reserved. © Copyright 2002, Technical Analysis, Inc.
Return to March 2002 Contents