CHARTING
The Breakout After The Breakout
Post-Breakout Patterns
by David Penn
Look for these patterns to determine if breakouts continue.
In technical analysis, one of the benefits of focusing on chart patterns is that practice trains the eye to spot emerging chart patterns. This may enable a trader to take a position before an actual breakout occurs, thus increasing the profitability of a correct call. When chart patterns occur as part of an observable trend, the breakout (or breakdown, in the bearish case) can become a place to add to a position, or to place a protective stop.
One of the biggest benefits to traders who study chart patterns is their increased possibility of finding patterns in bunches. Too often, a single chart pattern becomes the beginning and ending of the discovery, when continued observation might lead to uncovering another chart pattern emerging from the breakout or breakdown. While patterns after patterns are not typical, keeping an eye on what prices are doing even during a successful break can at times lead to even greater rewards than treating each chart pattern on an individual - and isolated - basis.
POST-BREAKOUT PATTERNS
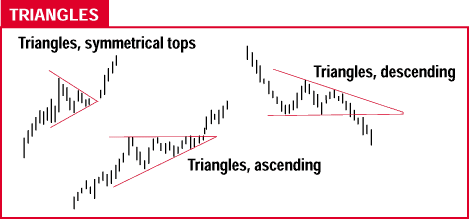
Some of the more important post-breakout patterns are continuation patterns such as trianglesÝ (symmetrical, ascending, and descending), flagsÝ (and pennants), and wedgesÝ (rising and falling). Each of these patterns has its own specific price action that makes it relatively easy to recognize, and each represents a different set of competing buyers and sellers.
Understanding the relationship between buyers and sellers in the periods leading up to the chart pattern (bullish, bearish, or neutral trend) makes it easier to read the bull/bear struggle as it is played out both in the chart patterns and in the break. Further, understanding this relationship between the bulls and the bears will make it easier to read any subsequent chart pattern that emerges once the breakout or breakdown is complete.

Figure 1: Examples of different triangle types can be seen here. In the symmetrical triangle, trendlines are cast along a series of lower highs and higher lows, and prices are generally expected to resume the primary trend when they emerge from the pattern.
...Continued in the April 2002 issue of Technical Analysis of STOCKS & COMMODITIES
Excerpted from an article originally published in the April 2002 issue of Technical Analysis of STOCKS & COMMODITIES magazine. All rights reserved. © Copyright 2002, Technical Analysis, Inc.
Return to April 2002 Contents