THEORY
Is There Any Consistency In The Markets?
How Random Is The Dow?
by Tony Baker and William Arnold
This study looks at the market fluctuations of the DJIA to determine if there is any consistency in the markets.
One of the best-known, universally reliable characteristics of the financial markets is their tendency to fluctuate. In times of optimism or pessimism, rising or falling interest rates, inflation or deflation, these deviations from short- and long-term trendlines are the center of attention. While the theory that these fluctuations are to some extent random is now widely accepted, we recently undertook a statistical study of 100 years of daily Dow Jones Industrial Average (DJIA) closing prices, looking for consistent short-term tendencies to supplement mechanical systems for trading index futures. Not surprisingly, the results have implications for other trading vehicles as well.

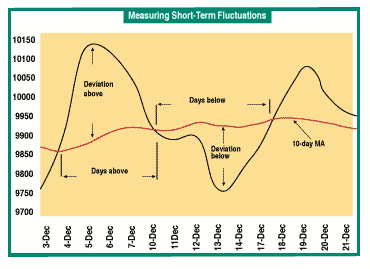
Figure 1: Short-term fluctuations. A simple display of prices deviating from the moving average.
The DJIA suits our overall purpose of developing information for index trading, and a large number of available datapoints makes this series an attractive and popular source of statistical data. After surveying several time frames, we decided to focus on short-term deviations of the closing price from a 10-day moving average (MA) to look for general consistency. Although many traders may use longer time frames such as 50-day averages, these tend to obscure the shorter-term moves we were studying. All we looked at were the closing prices and the 10-day simple MA, and used percentages to make comparisons simpler.
TERMINOLOGY
The chart displayed in Figure 1 of DJIA daily closes from December 3 to December 21, 2001, illustrates the terminology we will use in discussing results. We looked at and tabulated the number of days the DJIA spent above or below the MA, and at its maximum percentage deviation from the trendline during each period.
The 100-year period included 27,380 trading days and 4,098 penetrations of the 10-day MA (2,049 crosses in each direction). These magnitude and duration values are displayed in Figure 2. Over this 100-year period, the average maximum departure above the 10-day MA was +1.6% and the average maximum deviation below was -1.6%, but the duration of the excursions was substantially different, with the average time spent above the MA nearly two trading days longer than the time spent below it. This reflects the overall upward trend in the series.
The bar graph in Figure 3 displays a different breakdown of this simple deviation data during different time periods. The short-term deviations have been surprisingly consistent. If the underlying dynamics of markets have changed over the long period examined, you can't recognize it from this data. On a percentage basis, the average deviation of these moves is roughly the same for 1901-10 (1.4% above, 1.6% below) as for 1991-2000 (1.5% above, 1.4% below). This implies that logical stop or profit levels set on a percentage basis are valid, no matter what period is being surveyed.
...Continued in the May 2002 issue of Technical Analysis of STOCKS & COMMODITIES
Excerpted from an article originally published in the May 2002 issue of Technical Analysis of STOCKS & COMMODITIES magazine. All rights reserved. © Copyright 2002, Technical Analysis, Inc.
Return to May 2002 Contents