TRADING TECHNIQUES
Using Volatility And Correlation
Daytrading Stock Pairs
by Mark Conway and Aaron Behle
Tired of trading Level II quotes and one-minute charts? Try a market-neutral strategy.
It can take years of experience to discover one unique insight to exploit that can consistently pull money out of the stock market. Most traders have a bias as to market direction and position themselves accordingly; however, market-neutral strategies are becoming popular for those who are tired of trading on the gerbil wheel of Level II quotes and one-minute charts.
Pairs trading is a market-neutral strategy where a long position in one stock and a short position in a correlated stock are taken simultaneously. The profit principle of the trade is based on mean reversion - that is, two stocks that normally trade in the same direction become temporarily uncorrelated and eventually will revert to the mean.
All of the published work on pairs trading relates to positions held over several days or as much as several months (for example, mergers and acquisitions). However, recent changes in margin requirements give the daytrader access to as much as 4:1 intraday buying power, which is perfectly suited to intraday pairs trading.
This article presents a complete strategy for daytrading stock pairs. First, a definition for the spread is presented, along with a visual TradeStation indicator. Second, the volatility bands will be calculated to determine when a pairs trade is initiated. Third, the complete entry and exit rules for the intraday pair trading system are defined. Finally, examples are shown, complete with performance summaries.
The allure of pairs trading is that it is a strategy with little risk; however, no stock is immune to the risk of a trading halt or an earnings warning. As with every other trading system, specific entry points, exit points, profit targets, and stop-losses need to be defined. First, I'll review the factors required for calculating the spread and the upper and lower bounds known as volatility bands.
THE SPREAD
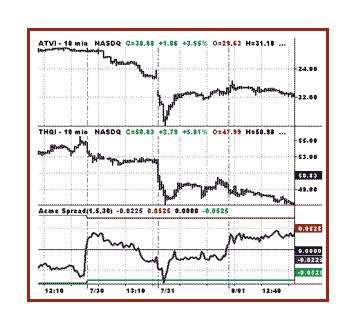
The spread is a separate plot (see Figure 1) that compares the difference in price between two stocks and plots this value as a black line in real time within the volatility bands. The red line is the upper volatility band, and the green line is the lower volatility band; these bands are computed at the beginning of each trading day.

Figure 1: THE SPREAD. It's a simple calculation that compares the difference between two stocks.
When the spread line touches the upper band, the stock in the top panel (stock A) has become overvalued relative to the stock in the lower panel (stock B) - a condition indicating that stock A should be shorted and stock B should be bought. When the spread touches the lower band, stock A has become undervalued relative to stock B. In this case, stock A should be bought and stock B should be shorted at the same time.
The spread can be calculated according to the following formula:
Spread = (LastA/CloseA) - (LastB/CloseB)
Divide the last price of stock A by its closing price yesterday, and do the same for stock B. Subtract the difference to obtain the current spread.
...Continued in the May 2002 issue of Technical Analysis of STOCKS & COMMODITIES
Excerpted from an article originally published in the May 2002 issue of Technical Analysis of STOCKS & COMMODITIES magazine. All rights reserved. © Copyright 2002, Technical Analysis, Inc.
Return to May 2002 Contents