OPTIONS
Confused By The Market's Erratic Movements?
Taming The Volatility Beast
by Kevin Lund
Take advantage of volatility and play those options.
If you've traded options for any length of time, you've probably experienced the following scenario: You spot a stock that seems to have some good swings. After watching it drop for a few days, your technical analysis suggests the selling was simply profit-taking, and you feel the stock will move up soon. So you buy some call options. Over the next couple of days, however, as you watch your stock climb modestly, the value of your options drops, probably because you purchased expensive options.
This kind of situation is common, and is one of the reasons many traders and investors shy away from the options market. But there are also many who trade options every day with great success because of their ability to harness volatility. Volatility is perhaps the most misunderstood component of options trading, which is why many who blindly dive into the options market do so with limited success when they start out.
WHAT IS VOLATILITY?
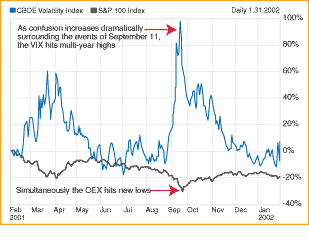
Volatility is nothing more than confusion in a market, and is defined as the rate of change in price over a specific time period. When market conditions become uncertain, there is a good deal of confusion as to where the bulls and bears believe the fair value of that market lies. When they can't agree on the fair value, the confusion manifests itself in the form of large swings in the price of stocks. As uncertainty increases, the market tends to fall as buyers become scarcer and the sellers take control. The result is an increase in volatility and, subsequently, inflated option premiums.

Figure 1: Correlating VIX and the OEX. Note the near mirror-image correlation between the OEX and the CBOE volatility index.
There are two types of volatility that options traders need to be concerned with: historical and implied. Historical volatility (HV) is a measure of the change in the price of an underlying security or index over a period of time relative to the past performance of that security or index. If a stock is trading at a one-year high of $100 today, but was trading at $70 one year ago at its low, then it is said to have a one-year historical volatility of 30%. Therefore, it can be expected to fluctuate within 30% of its current price of $100 (between $70 and $130) approximately 68% of the time over the next year, or one standard deviation, as it is referred to in statistical circles (this is why historical volatility is also known as "statistical" volatility).
...Continued in the May 2002 issue of Technical Analysis of STOCKS & COMMODITIES
Excerpted from an article originally published in the May 2002 issue of Technical Analysis of STOCKS & COMMODITIES magazine. All rights reserved. © Copyright 2002, Technical Analysis, Inc.