CHARTING
Using The Natural Order
Projected Fibonacci Targets
by Mohab Nabil
Here's a new technique for determining price targets after a breakout from a previous price swing.
Fibonacci analysis, which is employed by practitioners of various sciences such as astronomy, mathematics, and architecture, also has a role in projecting price targets of financial securities. After working with Fibonacci ratios for several years, I developed a new technique for determining price targets after a breakout (up or down) from previous price swings, which I call projected Fibonacci targets (PFT).
THE BASICS
Before applying the PFT, it is important to understand that broken support levels often become resistance levels during subsequent rallies, especially if a broken support level coincides with a Fibonacci retracement level.

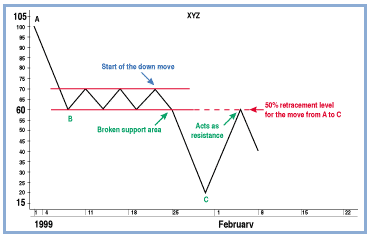
Figure 1: CLASSIC EXAMPLE OF A DOWNTREND. Once a support level is broken, it acts as a resistance level.
Figure 1 shows a hypothetical example of a price downswing from point A to point B, followed by a consolidation area, and finally a breakdown to point C (a classic example of a downtrend). The broken support level established during the consolidation now acts as resistance for the subsequent rally. The resistance at $60 also represents a 50% retracement of the move from A to C ($100 to $20).
Figure 2, the chart of Xilinx, Inc. (XLNX), from October 4, 2001, to November 2001 shows a downswing from point A to point B. The trend halted temporarily and formed a consolidation area with support at around $58. After breaking below $58, the new downswing reached a low of $35. Prices then rallied from this low back to $58 - an important level, because it was the support level of the previous consolidation. It has now reversed its role and is acting as resistance. The move from $35 to $58 is approximately a 38.2% retracement of the move from $92 to $35 ($92 - $35 = $57 * 0.382 = $21.77 + $35 = $56.77).
This example reveals that when a resistance level (or a support level) is formed by breaking previous support (or breaking previous resistance), it often coincides with a Fibonacci ratio (of 23.6%, 38.2%, 50%, or 61.8%) of the whole move, resulting in a resistance (or support) level that is not easily breached.
...Continued in the May 2002 issue of Technical Analysis of STOCKS & COMMODITIES
Excerpted from an article originally published in the May 2002 issue of Technical Analysis of STOCKS & COMMODITIES magazine. All rights reserved. © Copyright 2002, Technical Analysis, Inc.