CHARTING
We See Them Often, But What Do They Mean?
Making Cents Of
Throwbacks and Pullbacks
by Thomas Bulkowski
What are they and how can we use them? Find out what they are and how they perform.
When I started investing more than 20 years ago, I thought technical analysis was nothing more than mysterious squiggles on a chart. Now, I am a chart pattern trader who's not afraid to dig for answers. While completing work on my latest book, Trading Classic Chart Patterns, I uncovered some intriguing performance tips for stock investors and chart pattern traders. This article discusses those tips for throwbacks and pullbacks.
BACKGROUND AND IDENTIFICATION TIPS
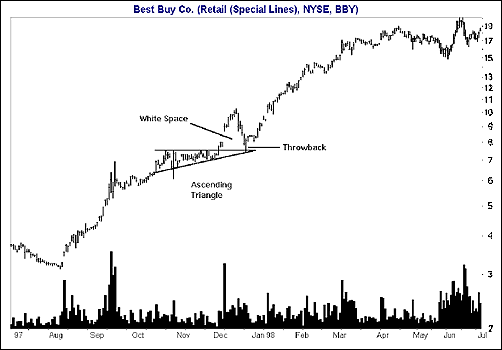
What are throwbacks and pullbacks? Figure 1 shows an example of a throwback after an upward breakout from an ascending triangle. A throwback occurs when prices quickly return to the breakout price. After the throwback completes its journey, prices usually continue climbing.

Figure 1: Throwback. A throwback completes within 30 days of the upward breakout and shows white space between the breakout and ascending triangle boundary.
Here are three rules to identify throwbacks:
1. Prices must return to, or come close to, the breakout price or trendline. Prices can drop below the breakout price or pierce a trendline boundary, but ignore anything that doesn't come close. (Use your best judgment to define close.)
2. Prices must complete the throwback within 30 days. I usually adhere to this rule, especially when I am collecting statistics, but you may choose your own guideline; 30 days is arbitrary. Anything beyond this I attribute to normal price behavior.
3. Prices must leave white space between the curling action of the throwback
and the chart pattern. I use this rule to eliminate those patterns in which
prices slide along the chart pattern instead of looping around. This isn't
baseball: sliders aren't allowed.
...Continued in the June 2002 issue of Technical Analysis of STOCKS & COMMODITIES
Excerpted from an article originally published in the June 2002 issue of Technical Analysis of STOCKS & COMMODITIES magazine. All rights reserved. © Copyright 2002, Technical Analysis, Inc.