PATTERNS
What Happens After Prices Hit A Critical Support Or Resistance Level?
Moving Averages And The Slingshot Effect
by Bo Yoder
Watch the bulls and bears battle for supremacy to determine market direction.
Moving averages (MAs) are among the simplest and most effective tools in any trader's arsenal. They offer moving areas of support and resistance, harnessing the market's tendency to revert to the mean. The market often cycles against these "averaged" levels as the whipsaws and wiggles of a new trend begin to form. The 20-period moving average is a commonly watched indicator. When prices are above the moving average it's seen as a test of support, whereas when prices are below the moving average it's seen as a test of resistance. The way the market treats this barrier to price movement as the bulls and bears battle for supremacy can offer strong directional clues for observant traders.
LET THE BATTLE BEGIN
Any technical area of support or resistance offers market participants an excuse to take action. In Figure 1, the first circle shows a clean bounce or bear flag. After the QQQ sold off, it found an area of support. The cycle of shorts covering and longs entering carried the price up to test the 20-period MA (green line). At this level of moving average resistance, the QQQ could have done one of two things: respect the resistance in the context of a downtrend and sell off, or break through the resistance. As you can see, this was a perfect test of resistance, with a pivotal trend change right at the moving average resistance level, then a continuation of the downtrend. After this test the stock sold off, breaking to new lows.
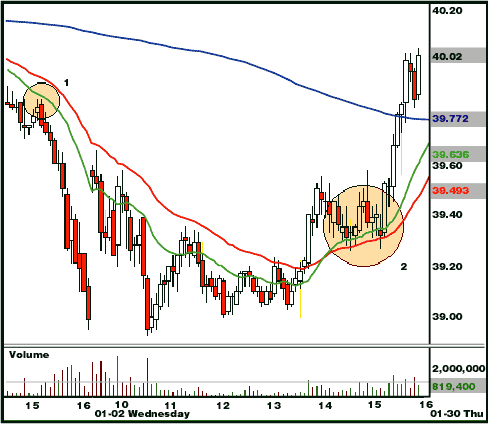
Figure 1: Intraday chart of the QQQ. Note how the bulls and bears battle for supremacy when they approach the moving averages.
...Continued in the June 2002 issue of Technical Analysis of STOCKS & COMMODITIES
Excerpted from an article originally published in the June 2002 issue of Technical Analysis of STOCKS & COMMODITIES magazine. All rights reserved. © Copyright 2002, Technical Analysis, Inc.