June 2002
TRADERS' TIPS
You can copy these formulas and programs for easy use in your spreadsheet or analysis software. Simply "select" the desired text by highlighting as you would in any word processing program, then use your standard key command for copy or choose "copy" from the browser menu. The copied text can then be "pasted" into any open spreadsheet or other software by selecting an insertion point and executing a paste command. By toggling back and forth between an application window and the open Web page, data can be transferred with ease.
This month's tips include formulas and programs for:
TRADESTATION: Trend intensity index
METASTOCK: Trend intensity index
eSIGNAL: Trend intensity index
AIQ: Trend intensity index
NEUROSHELL TRADER: Trading IBM intraday
NEUROSHELL TRADER: Trend intensity index
WEALTH LAB: Trading IBM intraday
WEALTH LAB: Trend intensity index
TRADING SOLUTIONS: Trend intensity index
Investor/RT: Trend intensity index
WAVEWI$E Market Spreadsheet: Trend Intensity Index
or return to June 2002 Contents
![]() TRADESTATION:
Trend intensity index
TRADESTATION:
Trend intensity index
In his article in this issue, M.H. Pee presents his trend intensity index (TII), which is an index designed to help determine the strength of a trend. In the article, Pee has included the formulas for a spreadsheet implementation of the TII indicator and trading strategy. Here, we present the TradeStation EasyLanguage code for the Tii trading strategy. The strategy can easily be converted into a TradeStation indicator by replacing the buy/sell statements with plot statements.
The EasyLanguage code presented here will also be available for download at www.tradestation2000i.com. Select Support > EasyLanguage > Strategies and Indicators > Traders Tips, and look for the file TrendIntensityIndx.Els. (Keep in mind that the Sell Short statement in TradeStation 6 is equivalent to the Sell statement in previous versions of TradeStation.)
Strategy: Trend Intensity Index
inputs:AvgLength( 60 ), DevCalcLength( 30 ) ;variables: Avg( 0 ), SDPlus( 0 ), SDMinus( 0 ), Dev( 0 ), Offset( 0 ), TII( 0 ) ;Avg = Average( Close, AvgLength ) ;SDPlus = 0 ;SDMinus = 0 ;for Offset = 0 to DevCalcLength - 1 begin Dev = Close[Offset] - Avg ;if Dev > 0 then SDPlus = SDPlus + Dev else SDMinus = SDMinus - Dev ; end ;TII = SDPlus / ( SDPlus + SDMinus ) * 100 ;if TII > 80 then Buy next bar market else if TII < 20 then Sell Short next bar market ;
-Ramesh DhingraGO BACK
Director, EasyLanguage Consulting
TradeStation Technologies, Inc. (formerly Omega Research, Inc.)
a wholly owned subsidiary of TradeStation Group, Inc.
www.TradeStation.com
In his article in this issue, M.H. Pee introduces the trend intensity index and trend intensity index trade position. These indicators can be easily recreated in MetaStock 6.52 or higher.
To create an indicator in MetaStock, select the "Indicator Builder"
from the Tools menu, click New, enter the code for the indicator, and then
click OK. Repeat for the remaining indicators.
When plotting the trade position formula, a value of 1 indicates a long position and a value of -1 indicates a short position.Name: Trend Intensity IndexFormula:x:=Input("number of periods", 5,100,30);ma:=Mov(C,2*x,S);sdp:=Sum(If(C-ma>0, C-ma,0),x);sdm:=Sum(If(ma-C>0, ma-C,0),x);(sdp/(sdp + sdm)) * 100Name: Trend Intensity Index - trade positionFormula:x:=Input("number of periods", 5,100,30);ma:=Mov(C,2*x,S);sdp:=Sum(If(C-ma>0, C-ma,0),x);sdm:=Sum(If(ma-C>0, ma-C,0),x);tii:= (sdp/(sdp + sdm)) * 100;If(tii>=80, 1, If(tii<=20,-1, 0))
If you have questions creating an indicator, call us at 801 265-9998 or e-mail us at support@equis.com.
GO BACK
-William Golson, Equis International, Inc.
www.equis.com
![]() eSIGNAL:
Trend Intensity Index
eSIGNAL:
Trend Intensity Index
The new eSignal 7.0 offer users the best in technical analysis through
its new advanced charting window and formula studies language. Using the
eSignal Formula Script (EFS) language, which uses pure JavaScript, you
can develop your own indicators right in the eSignal editor. EFS offers
flexibilty since it allows you to write sophisticated indicators using
loops (for/next, do/while), a multitude of variables, and even call other
indicators.
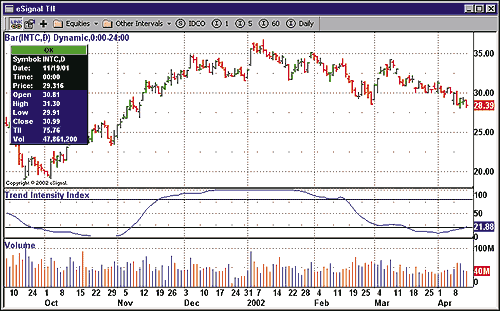
Figure 1: eSignal: Trend intensity index. Here's a sample chart of M.H. Pee's trend intensity index as seen using eSignal's latest advanced charting features.
Here is the formula for M.H. Pee's trend intensity index, as well
as a sample chart (Figure 1) depicting the study.
____________________________________GO BACK
function prEMAin() { setStudyTitle("Trend Intensity Index"); setCursorLabelName("TII"); setStudyMin(-1); setStudyMax(101);>addBand(20, PS_SOLID, 1, Color.black); addBand(80, PS_SOLID, 1, Color.black);} >var nLengthMA = 60; var nLengthTII = 30; function main() { var vMA = call("/Library/MA.efs", nLengthMA); var arC = close(0, -nLengthTII); if(arC == null) return;>var i; var dSDP = 0, dSDM = 0; for(i = 0; i < nLengthTII; i++) { if(arC[i] > vMA) { dSDP += arC[i] - vMA; } else if(arC[i] < vMA) { dSDM += vMA - arC[i]; } }return (dSDP / (dSDP + dSDM)) * 100; } >_____________________________________
-eSignal, a division of Interactive Data Corp.
510 723-1720, www.esignal.com
![]() AIQ:
Trend Intensity Index
AIQ:
Trend Intensity Index
Here is the EDS code for implementing M.H. Pee's trend intensity index in AIQ.
MovAvg is SimpleAvg([Close], 60).
UpDev is MovAvg - [Close].
DownDev is ABS([Close] - MovAvg).
MoverClose is IFF(MovAvg > [Close],UpDev,0).
MunderClose is IFF(MovAvg < [Close],DownDev,0).
SumUp30 is SUM(MoverClose, 30).
SumDn30 is SUM(MunderClose, 30).
TrendIntensityIndex is (SumUp30) / ((SumUp30) + (SumDn30)) * 100.
Editor's note: This will also be posted as a downloadable
EDS file at STOCKS & COMMODITIES' website at Traders.com.
-AIQ SystemsGO BACK
www.aiqsystems.com
In "Trading IBM Intraday" in this issue, Dennis Meyers makes use of the Meixner polynomial. The complete mathematics of the Meixner polynomial weren't given in the article nor in "The Yen Recursed," also by Meyers in the December 1998 issue of STOCKS & COMMODITIES. The average reader will be hard-pressed to do the mathematical research necessary to reproduce the Meixner polynomial prediction of the next bar. Therefore, to predict the next price bar, we used a tool already widely available to S&C readers in a number of software products: a neural net. Since neural nets already weight their inputs adaptively, the fading of appropriate past points on the curve is automatic.
Instead of predicting the price curve, we predicted the price change (momentum) curve, feeling that price change is more normalized over time than price.
We built a neural net whose inputs were the last four price changes, and asked it to predict the next price change. We used NeuroShell Trader's default neural net trading rules: Buy when the prediction exceeds a certain threshold, and sell when the prediction is below a threshold. We also used the Prediction Wizard's walk-forward capability and built-in optimizer to find the proper thresholds over the one-month period prior to the one-week out-of-sample period, just as the author did. Training of the net also took place during the month prior to the out-of-sample period.
Unlike the author, however, we felt it was more realistic to include commissions, so we assigned an $8 commission to each trade entry or exit. For the one-week period from 1/25/02 through 2/1/02, our model netted $10,630 after paying commissions, compared to the Meixner polynomial net of $6,040 before paying commissions. This was accomplished on 20 trades, where 85.7% of the shorts were profitable and 66.7% of the longs were profitable. The maximum number of consecutive winners was 10, and the maximum number of consecutive losers was 1.
Since the "fading memory" of the Meixner polynomials is one of their key features, we wanted to see how the neural net "faded its memory." The Prediction Wizard reported the following contributions for its inputs:
Time t price change: 16.22%time t-1 price change: 37.47%time t-2 price change: 41.53%time t-3 price change: 4.78%
Thus, the neural net determined that fading should not occur until
the fourth bar back (we used five-minute bars), and that memory should
actually be sharper until then!
We agree with the author that walk-forward testing is important. NeuroShell
Trader's Prediction Wizard allows many walk-forward tests. It should also
be noted that the model we built for Ibm can almost automatically be applied
and retrained for many other stocks or commodities using the Add/Remove
chart pages facility.
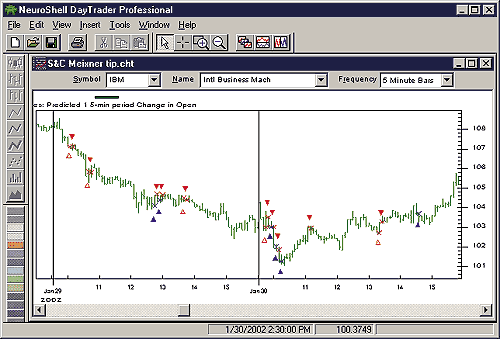
Figure 2: NeuroShell DayTrader Professional, IBM neural-net prediction. This neural network prediction based on Dennis Meyers' article in this issue netted $10,630.
Users of NeuroShell DayTrader Professional can go to the STOCKS
& COMMODITIES section of the NeuroShell Trader free technical support
website to download the chart (Figure 2) with the neural network prediction.
For more information on NeuroShell Trader, visit www.NeuroShell.com.
GO BACK
-Marge Sherald, Ward Systems Group, Inc.
301 662-7950, sales@wardsystems.com
www.neuroshell.com
![]() NEUROSHELL
TRADER: Trend Intensity Index
NEUROSHELL
TRADER: Trend Intensity Index
M.H. Pee's trend intensity index can be easily implemented in NeuroShell Trader by using NeuroShell Trader's ability to call user-written external programs. These external programs can be written in C, C++, Power Basic (also Visual Basic using one of our add-on packages), and Delphi. We've created the trend intensity index in a program that you can download from the NeuroShell Trader free technical support website.
After downloading the custom indicator, you can insert it by doing the following:
1. Select "New Indicator ..." from the Insert menuAfter downloading the custom indicators, you can easily insert it or combine it with any of our more than 800 built-in indicators into a chart (Figure 3), prediction, or trading strategy.
2. Select the Custom Indicator category
3. Select the Trend Intensity Index
4. Insert the Time Series as you desire.
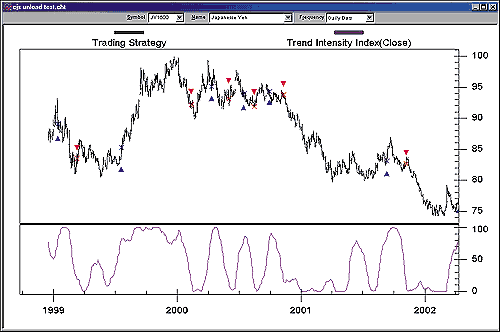
Figure 3: Neuroshell Trader, trend intensity index. Here's a NeuroShell Trader chart that graphically displays M.H. Pee's trend intensity index and specified trading strategy.To implement the trading strategy that M.H. Pee suggests:
1. Select "New Trading Strategy ..." from the Insert menuThe results from M.H. Pee's trading strategy could be greatly improved by using NeuroShell Trader Professional to optimize the thresholds that he has selected.
2. Select Next
3. On the Long Entry tab, enter the condition A>B(Trend Intensity Index(Close), 80)
4. Select Next
5. On the Short Entry tab, enter the condition A<B(Trend Intensity Index(Close), 20)
6. Select Next
7. Select Modify Trading Strategy Parameters and set the Entry commission to $75 and the Point Value for futures contract to $12.50. Select OK
8. Select Next
9. See the results and select Finish to see the trades onscreen.
Users of NeuroShell Trader can go to the STOCKS & COMMODITIES section of the NeuroShell Trader free technical support website to download a copy of any Traders' Tips.
For more information on NeuroShell Trader, visit www.NeuroShell.com.
-Marge Sherald, Ward Systems Group, Inc.GO BACK
301 662-7950, sales@wardsystems.com
www.neuroshell.com
![]() Wealth-Lab:
Trading IBM Intraday
Wealth-Lab:
Trading IBM Intraday
In the article "Trading IBM Intraday" in this issue, Dennis Meyers describes the technique of walk-forward optimization as applied to trading IBM on intraday one-minute bars. You can perform walk-forward optimization using the optimization tool in Wealth-Lab Developer 2.1.
We first need to collect sufficient historical data to conduct our optimization and out-of-sample tests. We downloaded 10,000 historical one-minute bars for IBM using data supplied by Quote.com. To gather historical data, select DataSources/New DataSource from the main menu. Select the DataSource type "Intraday Historical." You then choose the data provider you wish to use. Note that you must have an account with a data provider to collect the historical intraday data (we currently support Quote.com and eSignal). Next, specify the bar interval (one minute) and the number of bars to collect (10,000). The data is collected and stored locally so you can use it for backtesting purposes.
The next step is to optimize the system described in the article. For simplicity's sake, we'll use the first-order polynomial (an EMA) instead of the fourth order. Our script contains three optimization variables: the EMA period, the EMA percentage move up to trigger a long, and the EMA percentage move down to trigger a short. Positions are exited five minutes before the market close.
We want to optimize this script on the first 8,000 bars of data only. To accomplish this, we established a date filter in the Options Dialog. The date filter will cause the Optimization tool to work with data only within the selected date range.
Next, we opened the script in the Optimization tool and selected our IBM Intraday Historical DataSource. We selected to perform an exhaustive optimization, which executes the system for every combination of optimization variables. Wealth-Lab Developer 2.1 also provides a Monte Carlo?style optimization, which can quickly find profitable parameter ranges for up to 10 optimization variables at once.
Once the optimization is complete, you can examine the results in a
variety of ways using the Results Explorer. You can view the raw tabulations,
or view a two-dimensional surface graph of any two optimization variables.
The graph can be rotated to give you an excellent visual representation
of the parameter dynamics. Figure 4 displays the graph of profit per bar
for PctUp by PctDown, with the EMA period set at 60. This produced a range
of profitable values centered around the 0.6 to 0.7 range for PctUp.
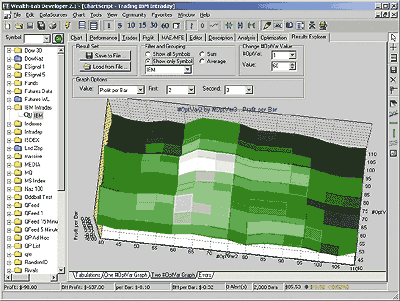
Figure 4: Wealth-Lab, walk-forward optimization on IBM intraday one-minute bars. In Wealth-Lab, you can view a two-dimensional surface graph of any two optimization variables. The graph can be rotated to give you an better visual representation of the parameter dynamics. This graph displays the profit per bar for PctUp by PctDown, with the Ema period set at 60. This produced a range of profitable values centered around the 0.6 to 0.7 range for PctUp.After a visual examination of the results, we set the default optimization variables to 60 for the EMA period, 0.65 for PctUp, and 0.85 for PctDown. We then ran the script on the out-of-sample data, using one share per position and no commission to measure the raw performance. The out-of-sample period that we tested was particularly bad for IBM, and included their earnings warning and price shock. Buy and hold results for the period (for one share) showed a loss of $12.74. The system results showed a much smaller loss of only $1.58, indicating the optimization was effective and would have saved us from some substantial losses.
Trading IBM Intraday Script
_______________________GO BACK{#OptVar1 10;10;100;10} {#OptVar2 85;40;110;5} {#OptVar3 85;40;110;5} var Bar: integer; var Pct, PctUp, PctDown: float; var xEMA, xLowestEMA, xHighestEMA, xChange: float; var bLastLong: boolean; PlotSeries( EMASeries( #Close, #OptVar1 ), 0, 500, #Thick ); PctUp := #OptVar2 / 10000; PctDown := #OptVar3 / -10000; bLastLong := true; xHighestEMA := EMA( #OptVar1, #Close, #OptVar1 ); for Bar := #OptVar1 to BarCount - 1 do begin xEMA := EMA( Bar, #Close, #OptVar1 ); { Looking to go short } if bLastLong then begin if xEMA > xHighestEMA then xHighestEMA := xEMA; if xEMA < xHighestEMA then begin xChange := ( xEMA - xHighestEMA ) / xHighestEMA; if xChange <= PctDown then begin if LastPositionActive then SellAtMarket( Bar + 1, LastPosition, '' ); xLowestEMA := xEMA; bLastLong := false; if GetTime( Bar ) < 1555 then ShortAtMarket( Bar + 1, '' ); end; end; end else{ Looking to go long } begin if xEMA < xLowestEMA then xLowestEMA := xEMA; if xEMA > xLowestEMA then begin xChange := ( xEMA - xLowestEMA ) / xLowestEMA; if xChange >= PctUp then begin if LastPositionActive then CoverAtMarket( Bar + 1, LastPosition, '' ); xHighestEMA := xEMA; bLastLong := true; if GetTime( Bar ) < 1555 then BuyAtMarket( Bar + 1, '' ); end; end; end; { Close position 5 minutes before close } if LastPositionActive then if GetTime( Bar ) >= 1555 then SellAtClose( Bar, LastPosition, '5 Min' ); end;-Dion Kurczek, Wealth-Lab, Inc.
www.wealth-lab.com
For our users' convenience, we've incorporated the trend intensity index
(TII) as a native indicator in Wealth-Lab, based on M.H. Pee's article
in this issue. The indicator is available on our Wealth-Lab.com website
and in our Wealth-Lab Developer 2.1 desktop software product (as of Build
20).
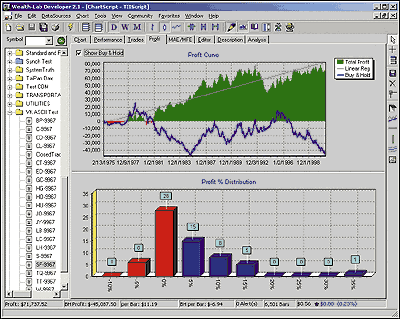
Figure 5: Wealth-Lab, trend intensity index. This shows the results of running M.H. Pee's TII system on Swiss franc continuous contract data from early 1975 through late 2000. This also displays the overall profit curve, as well as the trade profit distribution.TII works well on markets that tend to exhibit strong trends. We've tested it on a number of futures markets with encouraging results. Figure 5 shows the TII system run on Swiss franc continuous contract data from early 1975 through late 2000. One contract per position was taken, and $100 per trade was deducted for slippage and commission. Figure 5 also displays the overall profit curve, as well as the trade profit distribution.
GO BACKvar TIIPANE, BAR: integer; TIIPane := CreatePane( 80, true, true ); SetPaneMinMax( TIIPane, -5, 105 ); PlotSeries( TIISeries( #Close, 30, 60 ), TIIPane, #Gray, #Thick ); DrawLabel( 'TII(Close,30,60)', TIIPane ); for Bar := 90 to BarCount - 1 do begin if MarketPosition = -1 then begin if TII( Bar, #Close, 30, 60 ) > 80 then begin CoverAtMarket( Bar + 1, LastPosition, '' ); BuyAtMarket( Bar + 1, '' ); end; end else begin if TII( Bar, #Close, 30, 60 ) < 20 then begin SellAtMarket( Bar + 1, LastPosition, '' ); ShortAtMarket( Bar + 1, '' ); end; end; end;
-Dion Kurczek, Wealth-Lab, Inc.
www.wealth-lab.com
![]() NeoTicker:
Trend Intensity Index
NeoTicker:
Trend Intensity Index
To recreate in NeoTicker the indicator and system presented in "Trend Intensity Index" by M.H. Pee in this issue, first create an indicator called TII with two integer parameters, Period and MA Period (Listing 1). Then create the backtesting indicator script called tii_system with same set of parameters, plus an equity curve to show the performance of the system.
LISTING 1function TII() dim ma1 dim i, j, k, l dim denom, SDp if not data1.valid (0) then Itself.Success = false exit function end ifi = params.items(1).int - 1j = params.items(1).intif Heap.Size = 0 then Heap.Allocate (j+1) Heap.Fill 0, j, 0 end if'Make moving averageItSelf.MakeIndicator "myma", "average", Array("1"), _ Array(tq_integer2str(params.items(2).int))ma1 = ItSelf.Indicator ("myma")if not ma1.valid (0) then ItSelf.Success = false exit function end ifk = Heap.value(j) mod iHeap.Value(k) = Data1.Value (0) - ma1.Value (0)if Heap.Value (j) > i then SDp = 0 denom = 0 for l = 0 to i denom = denom + tq_abs(Heap.Value(l)) if Heap.Value(l) > 0 then SDp = SDp + Heap.Value (l) end if next TII = SDp/denom*100 else itself.success = false end if Heap.inc (j) end functionLISTING 2function tiisystem() dim mytii if Heap.size = 0 then Heap.allocate 1 with trade .monitor = true .closepositioneod = false .fillType = ftAverage .commissionType = cmFlatRate .commissionBaseAmount = 75 '.commissionBaseAmount = 0 .commissionPerUnit = 0 .initialcapital = 50000 .interestrate = 5 .pricemultiple = 1 end with end ifitself.makeindicator "mytii", "tii", Array("1"), _ Array(params.items(1).str, params.items(2).str)mytii = Itself.indicator ("mytii")if mytii.Value (0) >= 80 then if Trade.OpenPositionSize < 0 then Trade.ExitCurrentPosition "Exit Short" end if if Trade.OpenPositionSize <= 0 then trade.BuyAtMarket 100, " " end if elseif mytii.Value (0) <= 20 and mytii.value (0) > 0 then if Trade.OpenPositionSize > 0 then Trade.ExitCurrentPosition "Exit Long" end if if Trade.OpenPositionSize >= 0 then Trade.SellAtMarket 100, " " end if end if if mytii.valid (0) then tiisystem = Trade.CurrentEquity else itself.success = false end if if data1.isLastBar then with Trade .ReportAllTrades "" '.ReportAllOrders "" .ReportTradesSummary "" end with end if end function
The tii_system will return the current equity of the system (Figure
6) as well as reporting the test result to an opened report window.
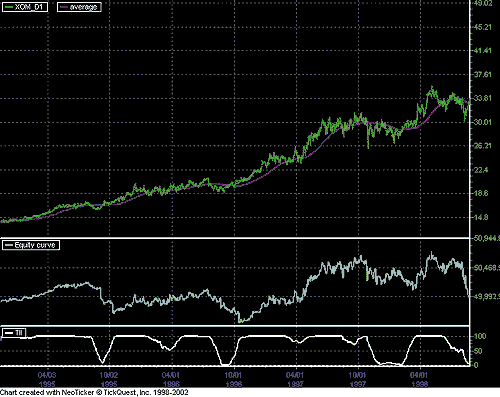
Figure 6: NeoTicker, trend intensity index. M.H. Pee's tii_system as implemented in NeoTicker returns the current equity of the system as well as reporting the test results to an opened report window.A downloadable version of the indicators will be available from the NeoTicker Yahoo! user group and the TickQuest website.
GO BACK
-Kenneth Yuen, TickQuest Inc.
www.tickquest.com
![]() TradingSolutions:
Trend Intensity Index
TradingSolutions:
Trend Intensity Index
The trend intensity index as described by M.H. Pee in this issue determines the current strength of a price trend based on deviations of previous prices from a current moving average. This type of functionality is easy to implement using the TradingSolutions function editor.
There are two functions used to calculate the trend intensity index:
To produce the value "Current: Ident (MA (Price,MA Period))", insert the (MA (Price,MA Period) into the formula. Then, select it and view the Special Processing page. Press the Add Level button to add the surrounding Identity function and then select "Use the current value of the selected function for all values in the surrounding array function." This tells TradingSolutions to use the current moving average for each iteration of the surrounding summation.Sum of Up DeviationsShort Name: SDPlusInputs: Price, Sum Period, MA PeriodSum (If (GT (Price,Current: Ident (MA (Price,MA Period))), Sub (Price,Current: Ident (MA (Price,MA Period))),0),Sum Period)Sum of Down DeviationsShort Name: SDMinusInputs: Price, Sum Period, MA PeriodSum (If (LT (Price,Current: Ident (MA (Price,MA Period))), Sub (Current: Ident (MA (Price,MA Period)), Price),0),Sum Period)
The trend intensity index can then be calculated as follows:
A trend intensity index system that trades when the trend intensity index is above 80 or below 20 could then be written as follows:Trend Intensity IndexShort Name: TIIInputs: Price, Sum Period, MA PeriodMult (Div (SDPlus (Price,Sum Period,MA Period), Add (SDPlus (Price,Sum Period,MA Period), SDMinus (Price,Sum Period,MA Period))),100)
These functions and the accompanying system are available in a function file that can be downloaded from the TradingSolutions website (www.tradingsolutions.com) in the Solution Library section. They can then be imported into TradingSolutions using "Import Functions..." from the File menu. Figure 7 shows a sample chart.Trend Intensity Index SystemInputs: Price, Sum Period, MA PeriodEnter Long: GT ( TII ( Price , Sum Period , MA Period ) , 80 )Enter Short: LT ( TII ( Price , Sum Period , MA Period ) , 20 )
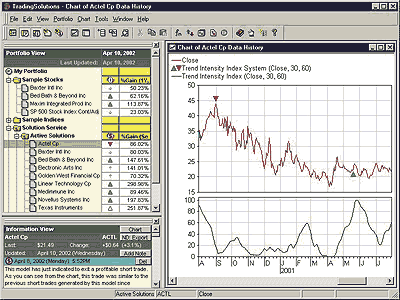
Figure 7: TradingSolutions. Here's a sample chart of the trend intensity index and system in TradingSolutions.It is also worth noting that the trend intensity index may make a good input to neural network predictions, especially in data where strong trends are present. When using it as an input to a prediction, you will typically want to set the preprocessing to "None," since the value of the trend intensity index is restricted to a limited range.
GO BACK
-Gary Geniesse, NeuroDimension, Inc.
800 634-3327, 352 377-5144
www.tradingsolutions.com
![]() Investor/RT:
Trend Intensity Index
Investor/RT:
Trend Intensity Index
Investor/RT has added a built-in technical indicator called the Trend
Intensity Index (TII), which is based on the indicator described by M.H.
Pee in his article in this issue, "Trend Intensity Index." TII can be calculated
on any price input, and using any moving average type. Figure 8 shows the
preferences available for TII.
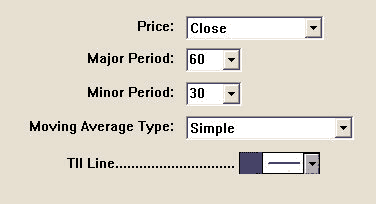
Two periods are available for the TII indicator: a major period and a minor period. The major period dictates the period over which the moving average is calculated. The minor period dictates the period over which the sum of the deviations of price from this moving average will be calculated. Pee recommends a major period of 60 and a minor period of 30. In the chart in Figure 9, TII is plotted in the lower pane in blue, with reference lines drawn at significant levels of 20 and 80. The preferences seen in Figure 8 are used to construct this TII line.
Figure 8: Investor/RT, preferences. Here are the preference settings available for the trend intensity index.
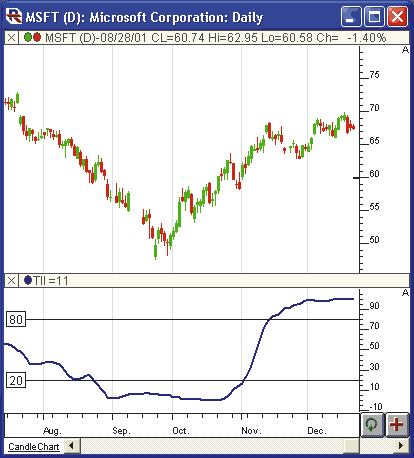
Figure 9: Investor/RT, sample chart. This Investor/RT chart illustrates the trend intensity index in the lower window pane with reference lines drawn at 20 and 80. The preferences seen in Figure 8 were used to construct this TII line.The trend intensity index has also been added to the Investor/RT Rtl Language, and assigned the token name TII. Rtl can be used to compose scans, custom indicators, backtest trading signals, annotations, and e-mail alerts. Pee states that a TII above 50 signals an uptrend, while a TII below 50 signals a downtrend. To scan for instruments that have just crossed from downtrending territory into uptrending territory, use the following syntax:
TII > 50 AND TII.1 <= 50
Similarly, to find instruments crossing from uptrending territory
into downtrending territory, use the following syntax:
GO BACKTII > 50 AND TII.1 <= 50
-Chad Payne, Linn Software
800 546-6842, info@linnsoft.com
www.linnsoft.com
The following WaveWi$e formulas calculate the trend intensity index.
GO BACKA: DATE @TC2000(C:\TC2000V3\Data,IBM,Internat Business Mach,DB)B: HIGHC: LOWD: CLOSEE: OPENF: VOLG:H: Avg @MAVG(CLOSE,60)I: Up @IF(CLOSE-AVG>0,CLOSE-AVG,0)J: Down @IF(AVG-CLOSE>0,AVG-CLOSE,0)K: UpSum @ADD(UP,30)L: DnSum @ADD(DOWN,30)M: Index 100*(UPSUM/(UPSUM+DNSUM))N: ' ==========End Formulas
-Peter Di Girolamo, Jerome Technology
908 369-7503, jtiware@aol.com
https://members.aol.com/jtiware
All rights reserved. © Copyright 2002, Technical Analysis, Inc.
Return to June 2002 Contents