TRADING TECHNIQUES
Short Or Long?
Analyze Net Positions
by Jon D. Andersen
Observe the commercials, noncommercials, and speculators -- determine who the leaders are, and what they're up to.
Commitment of traders-- (COT) data has, for many traders, been difficult to understand and apply. This has largely been because access to usable forms of the data has been limited, and analysis techniques have been sparse. However, the COT does provide useful information for understanding the dynamics of the futures markets.
In this article I will offer examples of analysis techniques for net positions between commercial, noncommercial (or large speculator), and small traders. Plotting the difference between the positions of these speculators provides a vast amount of useful information. Analyzing the net positions of the trader groups reveals what each group is doing. Are they adding to long positions? Are they selling long, adding to short positions, or reducing short positions? This information is useful because, generally speaking, each group takes positions for different reasons. As a result, you can see who the habitual losers and winners are for a given commodity, and thus identify potential opportunities.
When analyzing a group of market participants, many traders would suggest that you follow the commercials. This seems sensible: Since the commercial traders deal with the actual commodity, they must understand the real supply and demand levels. However, it is important to keep in mind that the commercials are not necessarily trying to profit from their contracts, but rather using them to stabilize their underlying price exposure. Noncommercial large traders and small traders are generally and independently holding positions to speculate about contract prices.
DIFFERENT BEHAVIORS
Each commodity tends to have a unique price behavior. For instance, grain, metal, currency, and index futures each have different variables that create supply and demand. A few examples include unique carrying costs, weather, processing, smelting, and shipping.
Because of these nuances, different groups of traders have tendencies
that can be identified. Figure 1 displays a Comex gold continuous contract
chart. In the window above the chart, the net positions of the commercials
(blue), noncommercials (green), and small traders (red) are plotted. If
a group is greater than zero, they are net long. If they are below zero,
they are net short.
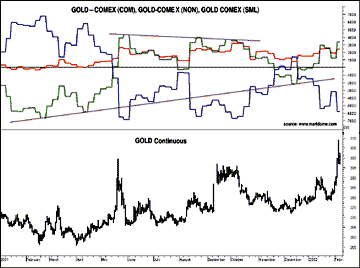
Figure 1: Comex gold. By looking at the net positions of the different types of traders, you can see which are net long and which are net short.
...Continued in the July 2002 issue of Technical Analysis of STOCKS
& COMMODITIES
Excerpted from an article originally published in the July 2002 issue of Technical Analysis of STOCKS & COMMODITIES magazine. All rights reserved. © Copyright 2002, Technical Analysis, Inc.