NEW TECHNIQUES
Understanding Leads To Confidence
Auction Market Theory And The Longer Time Frame
by Donald Jones
Knowing when market conditions change will put you ahead of the crowd.
Last issue, I provided an overview of Auction Market Theory. Two important facts should be kept in mind as I discuss the next stage, applying the theory: First, markets are not correlated on a day-to-day basis, and second, markets are in a continuous cycle. The lack of correlation precludes finding market condition from yesterday's market, but you still need to know the market condition to make trading decisions. You find out about market condition from the Overlay Demand Curve.
MARKET CONDITION FROM OVERLAYS
As traders, we speak casually about market condition. Is the market trending? Is the market unusually volatile? Has it crossed a resistance or support price? What path is the market expected to take? Trending implies a market that may be moving during a certain time frame. Support/resistance points are historical and rarely tied to current market activity, although ultimately, current activity may provide the next set of support/resistance points. But this rarely helps make today's decisions. Market condition plus a knowledge of the market cycle prepares you for whatever path the market takes.
You want to run with profits or stay in the hopes of more, but how do
you know if a good move will get better? Look at five sequential days of
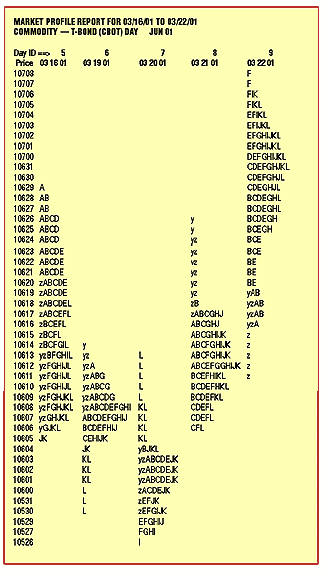
Market Profile in Figure 1. The display appears to be three days down (March
16, 19, and 20) followed by three days up (March 20, 21, and 22). If you
sum the five days, the longer-term view is one of balance, which can be
seen in the five-day Overlay in Figure 2 - a roughly bell-shaped curve
with upper and lower distribution limits at 10706 and 10528. The close
of trading at 10628 is well within the balance.

Figure 1: US Treasury bonds, March 16, 2001, through March 22, 2001.
...Continued in the July 2002 issue of Technical Analysis of STOCKS & COMMODITIES
Excerpted from an article originally published in the July 2002 issue of Technical Analysis of STOCKS & COMMODITIES magazine. All rights reserved. © Copyright 2002, Technical Analysis, Inc.