July 2002
TRADERS' TIPS
You can copy these formulas and programs for easy use in your spreadsheet or analysis software. Simply "select" the desired text by highlighting as you would in any word processing program, then use your standard key command for copy or choose "copy" from the browser menu. The copied text can then be "pasted" into any open spreadsheet or other software by selecting an insertion point and executing a paste command. By toggling back and forth between an application window and the open Web page, data can be transferred with ease.
This month's tips include formulas and programs for:
METASTOCK: DIVERGENCE FORMULAS
METASTOCK: ZERO-LAG DATA SMOOTHERS
TRADESTATION: ZERO-LAG DATA SMOOTHERS
AIQ SYSTEMS: ZERO-LAG DATA SMOOTHERS
eSIGNAL: ZERO-LAG DATA SMOOTHERS
Investor/RT: ZERO-LAG DATA SMOOTHERS
NEUROSHELL TRADER: ZERO-LAG DATA SMOOTHERS
NEOTICKER: ZERO-LAG DATA SMOOTHERS
TRADINGSOLUTIONS: ZERO-LAG DATA SMOOTHERS
WEALTH-LAB: ZERO-LAG DATA SMOOTHERS
SMARTRADER: ZERO-LAG DATA SMOOTHERS
TECHNIFILTER PLUS: ZERO-LAG DATA SMOOTHERS
or return to July 2002 Contents
![]() METASTOCK:
DIVERGENCE FORMULAS
METASTOCK:
DIVERGENCE FORMULAS
I've seen many divergence formulas written for MetaStock, but in my opinion, none of them work well. Here, I'll present a divergence formula for MetaStock using RSI(14) and the close. I'll also introduce another divergence formula, which I call double successive divergence (DSD).
Divergence formula
EKA:=3;I1:=Zig(RSI(14),EKA,%)>Ref(Zig(RSI(14),EKA,%),-1) ANDRef(Zig(RSI(14),EKA,%),-1)<Ref(Zig(RSI(14),EKA,%),-2);V1:=ValueWhen(1,I1,Ref(Zig(RSI(14),EKA,%),-1));V2:=ValueWhen(1,I1,Ref(C,-1));V3:=ValueWhen(2,I1, Ref(Zig(RSI(14),EKA,%),-1));V4:=ValueWhen(2,I1,Ref(C,-1));C1:=V1>V3 AND V2<V4 ;C1 AND Ref(C1,-1)=0 AND RSI(14)>Ref(RSI(14),-1)
Double successive divergence
I1:=Zig(RSI(14),3,%)>Ref(Zig(RSI(14),3,%),-1) ANDRef(Zig(RSI(14),3,%),-1)<Ref(Zig(RSI(14),3,%),-2);V1:=ValueWhen(1,I1,Ref(Zig(RSI(14),3,%),-1));V2:=ValueWhen(1,I1,Ref(C,-1));V3:=ValueWhen(2,I1, Ref(Zig(RSI(14),3,%),-1));V4:=ValueWhen(2,I1,Ref(C,-1));V5:=ValueWhen(3,I1, Ref(Zig(RSI(14),3,%),-1));V6:=ValueWhen(3,I1,Ref(C,-1));C1:=V1<V3 AND V2>V4 AND V3<V5 AND V4>V6 ;C1 AND Ref(C1,-1)=0 AND RSI(14)>Ref(RSI(14),-1)
With these formulas, RSI(14) may be replaced by other indicators
such as CCI, OBV, and so on. In addition, the time frame may be extended
from min
to years.
If readers find these formulas useful, next time I'll introduce some others using fractals.
--Siannas Christos, S&C readerGO BACK
![]() METASTOCK: ZERO-LAG DATA SMOOTHERS
METASTOCK: ZERO-LAG DATA SMOOTHERS
In "Zero-Lag Data Smoothers" in this issue, John Ehlers introduces two new filters, the infinite impulse response (IIR) filter and finite impulse response (FIR) filter. These filters can be easily recreated in MetaStock 6.52 or higher.
To create a filter in MetaStock, select Indicator Builder from the Tools menu, click New, enter the code for the filters, and then click OK. Repeat for the remaining filters.
Name: zero-lag IIR filter
formula:pds:=Input("number of periods",1,20,5);x:=2/(pds+1);xl:=LastValue((1/x)-1);(x*((2*C)-Ref(C,-xl))) +((1-x)*PREV)
Name: zero-lag FIR filter
formula:(C + (3.5*Ref(C,-1)) +(4.5*Ref(C,-2)) + (3*Ref(C,-3)) +(.5*Ref(C,-4)) - (.5*Ref(C,-5)) - (1.5*Ref(C,-6))) / 10.5
To plot the indicator, locate it in MetaStock's Indicator
Quicklist, then click and drag it onto the desired chart.
If you have questions creating an indicator, call us at 801 265-9998
or e-mail us at support@equis.com.
--William Golson, Equis International, Inc. www.equis.com
![]() TRADESTATION: ZERO-LAG DATA SMOOTHERS
TRADESTATION: ZERO-LAG DATA SMOOTHERS
In his article this issue on zero-lag smoothing, John Ehlers notes that his favorite filter is the symmetrically weighted six-bar finite impulse response (FIR) filter. This is also known as a triangular moving average, and can be conveniently implemented as a double-smoothed simple moving average. We provided the code for such a function in the January 2002 Traders' Tips, and it is reproduced here as well. To plot this as an indicator, first import this code into TradeStation, and then apply the built-in Custom 1 Line indicator with the formula input set to TriAverage_gen( Close, 6 ).
Per Ehlers, since this filter has six elements, its lag is 2.5 bars. Via further processing, this lag can be reduced to zero, but this produces too much overshoot. As a compromise, Ehlers suggests reducing the lag to one bar. To enable a user to adjust the lag easily, we provide the EasyLanguage code for an Adjustable Lag Fltr indicator below. The first input, Price, should typically be set to Close. The second input, LagReduction, should be set to a value in the zero-to-2.5 range. Setting it to zero will result in no adjustment, and the output will match that of the raw triangular average. Setting it to 2.5 will reduce the lag to zero. Setting it to 1.5 will reduce the lag to one bar.
Indicator: Adjustable Lag Fltr
Function: TriAverage_geninputs:Price( Close ),LagReduction( 1.5 ) ;variables:Numerator( 0 ),Denominator( 0 ),Filter( 0 ) ;arrays:Coeff[7]( 0 ) ;if CurrentBar = 1 thenbeginCoeff[1] = 1 ;Coeff[2] = 2 + LagReduction ;Coeff[3] = 3 + LagReduction ;Coeff[4] = 3 ;Coeff[5] = 2 - LagReduction ;Coeff[6] = 1 - LagReduction ;Coeff[7] = 0 - LagReduction ;Denominator = SummationArray( Coeff, 7 ) ;end ;Numerator = 0 ;for Value1 = 1 to 7beginNumerator =Numerator + Coeff[Value1] * Price[ Value1 - 1 ] ;end ;Filter = Numerator / Denominator ;Plot1( Filter ) ;
inputs:Price( numericseries ),Length( numericsimple ) ;variables:Length1( 0 ),Length2( 0 ) ;Length1 = Floor( ( Length + 1 ) * .5 ) ;Length2 = Ceiling( ( Length + 1 ) * .5 ) ;TriAverage_gen =Average( Average( Price, Length1 ), Length2 ) ;
The EasyLanguage code presented here will also be available for
download at www.tradestation2000i.com. Select Support -> EasyLanguage ->
Strategies and Indicators -> Traders Tips, and look for the file AdjustableLagFltr.Els.
--Ramesh DhingraGO BACK
Director, EasyLanguage Consulting
TradeStation Technologies, Inc. (formerly Omega Research, Inc.)
a wholly owned subsidiary of TradeStation Group, Inc.
www.TradeStation.com
![]() AIQ
SYSTEMS: ZERO-LAG DATA SMOOTHERS
AIQ
SYSTEMS: ZERO-LAG DATA SMOOTHERS
Here is the EDS code for implementing John Ehlers' finite impulse
response (FIR) filter in AIQ TradingExpert (Figure 1).
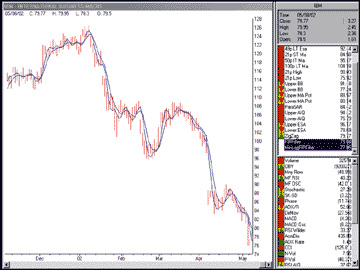
Figure 1: AIQ TradingExpert. Here's a sample chart of John Ehlers' finite impulse response (FIR) filter plotted in AIQTradingExpert.
GO BACKPrice is [close].Price1 is val([close], 1).Price2 is val([close], 2).Price3 is val([close], 3).Price4 is val([close], 4).Price5 is val([close], 5).Price6 is val([close], 6).FIRFilter is (Price + 2 * Price1 + 3 * Price2 + 3 * Price3 + 2 * Price4 + Price5) / 12.MinLagFIRFilter is (Price + 3.5 * Price1 + 4.5 * Price2 + 3 * Price3 + 0.5 * Price4 - 0.5 * Price5 - 1.5 * Price6) / 10.5.--AIQ Systems
www.aiqsystems.com
![]() eSIGNAL: ZERO-LAG DATA SMOOTHERS
eSIGNAL: ZERO-LAG DATA SMOOTHERS
The new eSignal 7.0 offers an advanced charting window and a formula studies language. Using the eSignal Formula Script (ERS) language, which uses pure JavaScript, you can develop your own indicators right in the eSignal editor. EFS offers flexibility, as it allows you to write sophisticated indicators using loops (for/next, do/while), a multitude of variables, and even call other indicators.
Here is the formula for John Ehlers' finite impulse response (FIR) indicator in ERS. Following that is the code for John Ehlers' infinite impulse response (IIR) indicator in EFS. Figure 2 is a sample eSignal chart displaying the FIR indicator. Figure 3 is a sample eSignal chart displaying the IIR indicator.
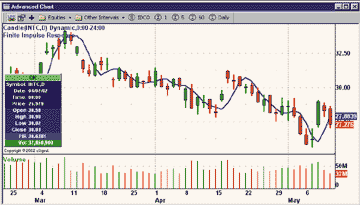
Figure 2: eSIGNAL, finite impulse response filter. Here is a demonstration of the finite impulse response indicator on a historical chart of Intel. This is an example of a custom formula in eSignal that can be written and modified in any text editor.
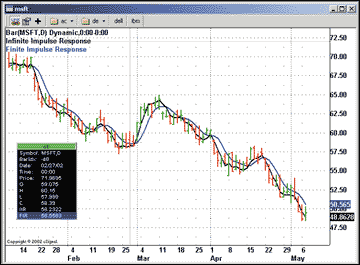
Figure 3: eSIGNAL, infinite impulse response filter. This plots the infinite impulse response indicator on a historical chart of Microsoft.
/********************************************************************************
Description: This formula plots the Finite Impulse Response
Provided By: This formula was created in the eSignal Formula Editor
Copyright 2002 eSignal, A division of Interactive Data Corporation
*********************************************************************************/
/********************************************************************************function preMain() {setPriceStudy(true);setCursorLabelName("FIR");setStudyTitle("Finite Impulse Response");setDefaultBarFgColor(Color.blue);setDefaultBarThickness(2);}function main() {var vPrice = close(0, -7);if(vPrice == null)return;// Ehlers' Favorite FIR filter// var vRet = (vPrice[0] + 2*vPrice[1] + 3*vPrice[2] + 3*vPrice[3] // + 2*vPrice[4] + vPrice[5]) / 12;// Formula for the minimum lag FIR filter.var vRet = (vPrice[0] + 3.5*vPrice[1] + 4.5*vPrice[2] + 3*vPrice[3] + 0.5*vPrice[4] - 0.5*vPrice[5] - 1.5*vPrice[6]) / 10.5;return vRet;}
Description: This formula plots the Infinite Impulse Response
Provided By: This formula was created in the eSignal Formula Editor
Copyright 2002 eSignal, A division of Interactive Data Corporation
*********************************************************************************/
function preMain() {setPriceStudy(true);setCursorLabelName("IIR");setStudyTitle("Infinite Impulse Response");setDefaultBarFgColor(Color.black);setDefaultBarThickness(2);}function main() {var vPrice = close(0, -5);var vRef = ref(-1);if(vPrice == null)return;if(vRef == null) {return vPrice[0];} else {return 0.2 * (2 * vPrice[0] - vPrice[4]) + 0.8 * vRef;}}--eSignal, a division of Interactive Data Corp.
510 723-1720, www.esignal.com
![]() Investor/RT: ZERO-LAG DATA SMOOTHERS
Investor/RT: ZERO-LAG DATA SMOOTHERS
Linn Software has just added a zero-lag option to the exponential moving average indicator in Investor/RT. This option is based on the infinite impulse filter (IIF) described by John Ehlers in his article in this issue, "Zero-Lag Data Smoothers."
Figure 4 shows the preferences for the exponential moving average, including the checkbox called "Zero Lag."
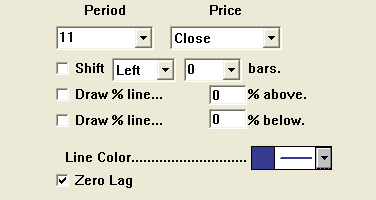
Figure 4: Investor/RT. Here's a dialog showing the Investor/RT preferences for the exponential moving average with zero lag.
The period specified may be any integer of decimal number. The equation
for computing the zero-lag exponential average follows:
EMA = K * ( 2 * PRICE - PRICE.X) + (1 - K) * EMA.1where:K = 2 / (N + 1)N = PeriodPRICE.X = Price X bars backX = lag = (N - 1) / 2
Figure 5 is an Investor/RT chart showing the zero-lag EMA, a zero-lag
MACD, along with a comparison of the zero-lag EMA with several other average
types.
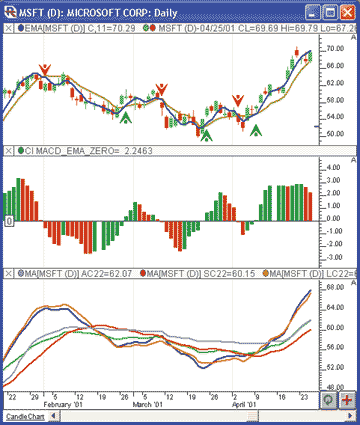
Figure 5: Investor/RT. Here's an Investor/RT chart displaying John Ehlers' zero-lag EMA (11-period in blue, 22-period in gold) in the top pane, zero-lag MACD in the middle pane, and a comparison of different averages in the bottom pane (zero-lag EMA in blue, adaptive in purple, EMA in green, simple in red, and least-squares in orange).
The upper pane shows buy and sell signals when the short-term (11-period)
and long-term (22-period) zero-lag EMAs cross. When the short-term crosses
above the long-term, a buy signal is indicated with a green up arrow ("signal
marker"). When the short-term indicator crosses below the long-term
one, a sell signal is indicated with a red down arrow.
The middle pane shows a custom indicator, drawn as a histogram, that represents the difference between the long- and short-term moving averages. The syntax for this custom indicator follows:
EMAa - EMAb
where EMAa is an 11-period zero-lag EMA, and EMAb is a 22-period
zero-lag EMA.
In the lower window pane, five different moving averages are compared, including zero-lag EMA in blue, adaptive in purple, EMA in green, simple in red, and least-squares in orange. Investor/RT offers 17 different smoothing options.
--Chad Payne, Linn Software
800 546-6842, info@linnsoft.com
www.linnsoft.com
![]() NEUROSHELL TRADER: ZERO-LAG DATA SMOOTHERS
NEUROSHELL TRADER: ZERO-LAG DATA SMOOTHERS
John Ehlers' zero-lag data smoother can be easily implemented in NeuroShell Trader by combining a few of NeuroShell Trader's 800+ indicators. We combined the Add, Divide, and Lag indicators to recreate Ehlers' zero-lag data smoother. NeuroShell Trader users can download it from the NeuroShell Trader free technical support website.
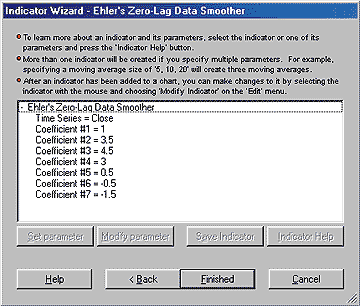
Figure 6: NeuroShell Trader. This shows the process of adding the Ehlers zero-lag data smoother using NeuroShell Trader's Indicator Wizard.
After downloading the custom indicator, you can insert it (Figure
6) by doing the following:
1. Select "New Indicator ..." from the Insert
menu.
2. Select the Custom Indicator category.
3. Select "Ehlers' Zero-Lag Data Smoother."
4. Select the parameters you desire (we've set the default as
the same parameters that Ehlers selected).
5. Select "Finished" and view the results on your
chart (Figure 7).
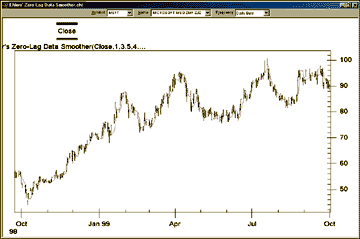
If you decide to use this indicator in a prediction or a trading strategy, the coefficients can be optimized by the genetic algorithm built into NeuroShell Trader Professional. Optimization can provide you with your own custom version of Ehlers' zero-lag data smoother that best fits your data.Figure 7: NeuroShell Trader. This NeuroShell Trader chart displays the Ehlers zero-lag data smoother.
For more information on NeuroShell Trader, visit our website or call 301 662-7950.
--Marge Sherald, Ward Systems Group, Inc.GO BACK
www.neuroshell.com
![]() NEOTICKER: ZERO-LAG DATA SMOOTHERS
NEOTICKER: ZERO-LAG DATA SMOOTHERS
In "Zero-Lag Data Smoothers" in this issue, John Ehlers applied a six-bar-long minimum-lag finite impulse response (FIR) filter to a data series. This can be easily recreated in NeoTicker using NeoTicker's formula language indicator.
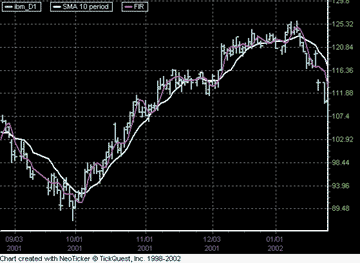
Figure 8: NeoTicker. Here's a sample chart of John Ehlers' FIR filter plotted in NeoTicker.
To recreate the FIR filter formula indicator in NeoTicker, you have
to create and set up a NeoTicker formula indicator and type in one line
(Listing 1). Then apply this indicator on a data series (Figure 8). The
result will be a minimum-lag finite impulse response filter.
Listing 1
Plot1 := (data1 + 3.5* data1(1) + 4.5* data1(2) + 3* data1(3)+ 0.5* data1(4) - 0.5* Data1(5) - 1.5* data1(6))/10.5
This indicator will also be available from the NeoTicker Yahoo user
group at https://groups.yahoo.com/group/neoticker.
--Kenneth Yuen, TickQuest Inc.
www.tickquest.com
![]() TRADINGSOLUTIONS: ZERO-LAG DATA SMOOTHERS
TRADINGSOLUTIONS: ZERO-LAG DATA SMOOTHERS
In his article on "Zero-Lag Data Smoothers" in this issue, John Ehlers presents minimal-lag versions of infinite impulse response (IIR) and finite impulse response (FIR) filters.
The zero-lag version of the exponential moving average (EMA) can be represented in two different ways. One version is a literal translation of the formula, requiring the precalculation of the lag. The second version calculates the lag automatically.
Zero-Lag IIR (Manual Lag)
Inputs: Price, Alpha, Lag of AverageAdd (Mult (Alpha,Sub (Mult (2,Price),Lag (Price,Lag of Average))), Mult (Sub (1,Alpha),Prev (1)))where Lag of Average should be set to 1/Alpha - 1
Zero-Lag IIR (Auto Lag)
Inputs: Price, AlphaAdd (Mult (Alpha,Sub (Mult (2,Price),LagVL (Price,Sub (Div (1,Alpha),1),20))), Mult (Sub (1,Alpha),Prev (1)))
Notice that the Variable Length Lag function is used to allow the
calculation of the length of the lag in the function. The maximum lag is
set to 20, allowing alpha to be as low as 0.05. Lower values of alpha can
be used by increasing the maximum lag in the function.
John Ehlers' FIR filter (which he states he favors) and the minimum-lag version of that filter can be represented in TradingSolutions as follows:
Ehlers' FIR (Original)
Ehlers' FIR (Minimum Lag)Inputs: PriceDiv (Add (Add3 (Price,Mult (2,Lag (Price,1)),Mult (3,Lag (Price,2))), Add3 (Mult (3,Lag (Price,3)),Mult (2,Lag (Price,4)),Lag (Price,5))),12)
Inputs: PriceDiv (Add (Add3 (Price,Mult (3.5,Lag (Price,1)),Mult (4.5,Lag (Price,2))), Add3 (Mult (3,Lag (Price,3)),Mult (0.5,Lag (Price,4)), Add (Mult (-0.5,Lag (Price,5)),Mult (-1.5,Lag (Price,6))))),10.5)
These functions are available in a function file that can be downloaded
from the TradingSolutions website in the Solution Library section. They
can then be imported into TradingSolutions using "Import Functions..."
from the File menu. Figure 9 shows a TradingSolutions chart comparing the
zero-lag IIR, John Ehlers' original FIR, and minimum-lag FIR to
an exponential moving average.
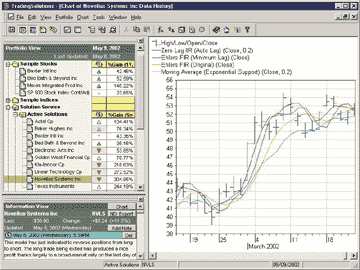
Figure 9: TradingSolutions. Here's a sample chart comparing the zero-lag IIR, John Ehlers' original FIR, and minimum-lag FIR to an exponential moving average in TradingSolutions.
It is also worth noting that filtering functions like these often
make good inputs to neural network predictions, especially in data where
strong trends are present. When using it as an input to a prediction, you
will typically want to set the preprocessing to "percent change,"
or calculate the percent difference between the current price and the value
of the filter.
--Gary Geniesse, NeuroDimension, Inc.GO BACK
800 634-3327, 352 377-5144
www.tradingsolutions.com
![]() WEALTH-LAB: ZERO-LAG DATA SMOOTHERS
WEALTH-LAB: ZERO-LAG DATA SMOOTHERS
The IIR and FIR data smoothers, as described by John Ehlers in this issue, are available as custom indicators on the Wealth-Lab.com website and Wealth-Lab Developer 2.1. To install the indicators into WLD2.1, select Community/Download ChartScripts from the main menu. This facility lets you download scripts that have been recently submitted by the Wealth-Lab community. You should increase the minimum number of days from the default of 7 to be sure that older scripts are included in the download (Figure 10).
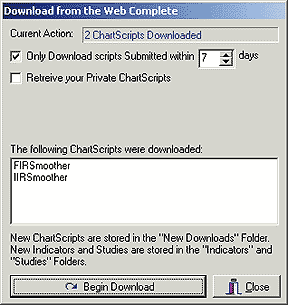
Figure 10: Wealth-Lab. Here's how to download scripts into Wealth-Lab from the Wealth-Lab website.
Once installed, you can treat them as any other indicator. You can
plot them on your charts using the "Plot Indicator" button
of the Indicators List (Figure 11), and you can use them in your custom
trading system rules.
GO BACK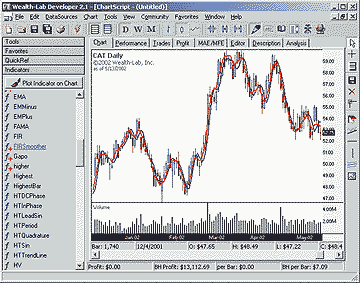
Figure 11: Wealth-Lab. Here's a sample chart of John Ehlers' IIR and FIR indicators plotted in Wealth-Lab.
--Dion Kurczek, Wealth-Lab, Inc.
www.wealth-lab.com
![]() SMARTRADER: ZERO-LAG DATA SMOOTHERS
SMARTRADER: ZERO-LAG DATA SMOOTHERS
In "Zero-Lag Data Smoothers" in this issue, John Ehlers presents a series of formulas designed to smooth data. We focused on the final version given at the end of the article.
Since the price used in the formula is an average of the high and low, we first create a SmarTrader user formula that sums the high and low prices for the bar and then divides by 2, creating a median price for the bar. In our example, a bar is 15 minutes in an intraday chart of the Dow Jones Industrial Average.
Then we constructed a user row for the actual smoothing formula for the FIR filter given at the end of the article. Note that a minus sign is used within the square brackets to indicate a backward reference.
The SmarTrader specsheet for the FIR filter is shown in Figure 12. A sample chart is shown in Figure 13.
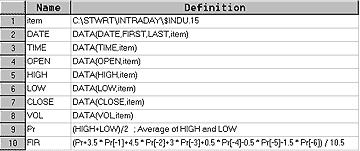
CompuTrac SNAP users can also implement this formula by omitting the minus inside the square brackets.Figure 12: SmarTrader. Here is the specsheet for the finite impulse response (FIR) filter.
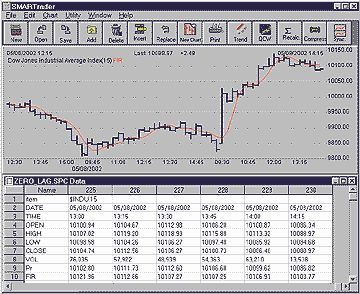
Figure 13: SmarTrader. Here is the finite impulse response (FIR) filter as plotted in SmarTrader.
--Jim Ritter, Stratagem Software
504 885-7353, Stratagem1@aol.com
![]() TECHNIFILTER PLUS: ZERO-LAG DATA SMOOTHERS
TECHNIFILTER PLUS: ZERO-LAG DATA SMOOTHERS
Here are the TechniFilter Plus formulas for the two zero-lag averages discussed by John Ehlers in his article in this issue, "Zero-Lag Data Smoothers."
Formula for zero-lagged EMA
NAME: LaggedEMASWITCHES: recursivePARAMETERS: .2INITIAL VALUE: CFORMULA: (2 * C - CY4) * (&1) + (1 - &1) * TY1
Formula for zero-lagged FIR
Visit RTR's website to download these formulas as well as program updates.NAME: FIRFORMULA: ( C + 2*CY1 + 3*CY2 + 3*CY3 + 2*CY4 + CY5 ) / 12
--Clay Burch, RTR SoftwareGO BACK
919 510-0608, rtrsoft@aol.com
www.rtrsoftware.com
All rights reserved. © Copyright 2002, Technical Analysis, Inc.
Return to July 2002 Contents