ANATOMY OF A TRADE
Riding The Roller-Coaster
The Bounce Trade
by Thomas Bulkowski
A double bounce following a long decline spells a trading opportunity. Find out why.
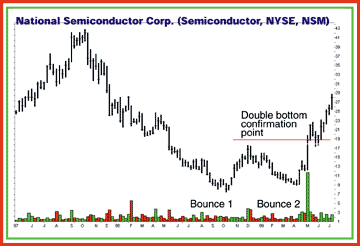
I'm not sure exactly how I happened upon this chart pattern. I noticed that after a long, perhaps straight-line decline, stocks often bounce -- not once but twice. Figure 1 displays an example of this. In the fall of 1997, National Semiconductor (NSM) peaked at $42.875, along with other stocks in the semiconductor industry. A year later, it reached a low of just $7.4375, an astounding decline of 83%. As can be expected, but rarely anticipated correctly, the stock bounced. Two months later, it climbed to a high of $17.625, more than double the nadir.

Figure 1: NATIONAL SEMICONDUCTOR CORP (NSM). Two bounces follow a long decline on the weekly scale. This is not a double bottom, because the price difference between the bottoms is almost 20%.
A retest of the low usually occurs, and that's what happened next. The stock declined to a low of $8.625 in early April 1999, retracing most of its gains. Although the twin lows appear to be a double bottom, strictly speaking, they're not. For a double bottom, the two lows should be within 4% of each other. Here, the price difference is almost 20%, though the discrepancy is more visible on the daily scale.
So why not trade the twin lows as if they formed a double bottom? In a word: money. By the time prices rise to the confirmation point, you've given up a lot of it. Look at Figure 2, a chart of Timberland Co. (TBL), and you'll see what I mean. The second low occurs at a price of $33, and the confirmation point is the highest high between the two lows, or $51.25 in this case. You'd have to wait for prices to climb more than 18 points, or 55%, before the double bottom confirms (meaning it's a true double bottom).
...Continued in the August 2002 issue of Technical Analysis of STOCKS & COMMODITIES
Excerpted from an article originally published in the August 2002 issue of Technical Analysis of STOCKS & COMMODITIES magazine. All rights reserved. © Copyright 2002, Technical Analysis, Inc.