INDICATORS
Is The Trend Established?
Zigzag Validity
by Spyros Raftopoulos
Trading opportunities in the forex market deserve serious consideration as a diversification strategy for your portfolio.
One of the most common tasks a technical analyst engages in is detecting and defining price trends. Among the numerous indicators and techniques that can be used for this purpose is the zigzag indicator. The zigzag filters out moves of minor importance (noise), making the main trend more obvious. Further, the zigzag presents the major moves with great clarity, since it connects peaks and troughs with straight lines that are easy to interpret.
You can select the price (open, high, low, or close) you want the zigzag to base its calculations on, and control the indicator's sensitivity (that is, the minimum amount prices must reverse before the new trend is considered established). Low values make zigzag more sensitive and volatile, whereas high values result in fewer moves that are of greater importance. The sensitivity can be measured either in points or as a percentage.
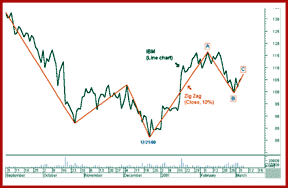
Figure 1 shows how clearly zigzag indicates 10% or higher moves of closing
prices, ignoring the smaller ones. If you knew on December 21, 2000, that
you were standing on a major swing point (lowest trough, in this case),
you would undoubtedly have invested your money in the expected upturn,
and in less than two months you would have seen your capital grow by more
than 40%.

Figure 1: ZIGZAG BASED ON CLOSE WITH A 10% THRESHOLD. Initially, it may seem that prices are beginning to start a new upward trend.
...Continued in the August 2002 issue of Technical Analysis of STOCKS & COMMODITIES
Excerpted from an article originally published in the August 2002 issue of Technical Analysis of STOCKS & COMMODITIES magazine. All rights reserved. © Copyright 2002, Technical Analysis, Inc.