September 2002
TRADERS' TIPS
Here is this month's selection of Traders' Tips, contributed by various
developers of technical analysis software to help readers more easily implement
some of the strategies presented in this and other issues.
You can copy these formulas and programs for easy use in your spreadsheet
or analysis software. Simply "select" the desired text by highlighting
as you would in any word processing program, then use your standard key
command for copy or choose "copy" from the browser menu. The copied text
can then be "pasted" into any open spreadsheet or other software by selecting
an insertion point and executing a paste command. By toggling back and
forth between an application window and the open Web page, data can be
transferred with ease.
This month's tips include formulas and programs for:
 TradeStation: SUPPORT AND RESISTANCE LEVELS
 MetaStock: SUPPORT AND RESISTANCE LEVELS
 NeuroShell TRADER: FUZZY PATTERNS
 NeuroShell TRADER: SUPPORT AND RESISTANCE LEVELS
 Wealth-Lab: SUPPORT AND RESISTANCE LEVELS
 Wealth-Lab: FUZZY PATTERNS
 NeoTicker: SUPPORT AND RESISTANCE LEVELS
 Investor/RT: SUPPORT AND RESISTANCE LEVELS
 TradingSolutions: SUPPORT AND RESISTANCE LEVELS
 WAVE WI$E: SUPPORT AND RESISTANCE LEVELS
or return to September 2002 Contents
 TRADESTATION: SUPPORT AND RESISTANCE LEVELS
In "Cueing Off Support And Resistance Levels" in this issue, author
Thom Hartle discusses how the previous week's high and low prices can be
used as support and resistance levels for the current week.
As Hartle states in the article, the first step is to plot two trendlines
going forward, one off the previous week's high and one off the previous
week's low. In the article, a how-to on plotting the trendlines manually
is given. In TradeStation, however, it is quite straightforward to implement
this as an indicator, just like MACD, and we present the EasyLanguage code
for such an indicator here. If you have TradeStation 6, you can see that
we used the code for the built-in Day Open-Hi-Lo Lines indicator as a starting
point for the code presented here.
Indicator: Weekly Hi-Lo Lines
{ This indicator is for use with daily charts and

  inserts 2 horizontal trendlines for each week, at the

  high and low of the previous week, respectively.  For

  the current week, the trendlines are extended to the

  right. }

inputs:

 HighColor( Yellow ),

 LowColor( Cyan ) ;

variables:

 HavePrevLines( false ),

 TLHigh( 0 ),

 TLLow( 0 ),

 WeekHigh( 0 ),

 WeekLow( 1000000 ),

 PrevWeekHigh( 0 ),

 PrevWeekLow( 0 ) ;

if DayOfWeek( Date ) < DayOfWeek( Date[1] ) then

{ ie, if new week }

 begin

 { truncate the previous lines if they exist }

 if HavePrevLines then

  begin

  TL_SetEnd( TLHigh, Date[1], Time[1],

   PrevWeekHigh ) ;

  TL_SetEnd( TLLow, Date[1], Time[1],

   PrevWeekLow ) ;

  TL_SetExtRight( TLHigh, false ) ;

  TL_SetExtRight( TLLow, false ) ;

  end ;

 { insert the new hi/lo lines and set their colors/

   extents }

 TLHigh = TL_New( Date[1], Time[1], WeekHigh,

  Date, Time, WeekHigh ) ;

 TLLow = TL_New( Date[1], Time[1], WeekLow,

  Date, Time, WeekLow ) ;

 TL_SetColor( TLHigh, HighColor ) ;

 TL_SetColor( TLLow, LowColor ) ;

 TL_SetExtLeft( TLHigh, false ) ;

 TL_SetExtLeft( TLLow,false ) ;

 TL_SetExtRight( TLHigh, true ) ;

 TL_SetExtRight( TLLow, true ) ;

 { re-initialize hi/lo variables }

 PrevWeekHigh = WeekHigh ;

 PrevWeekLow = WeekLow ;

 WeekHigh = High ;

 WeekLow = Low ;

 { set flag }

 if HavePrevLines = false then

  HavePrevLines = true ;

 end

else

 { if new hi/lo for week, save values }

 begin

 if High > WeekHigh then

  WeekHigh = High ;

 if Low < WeekLow then

  WeekLow = Low ;

 end ;
This code will also be available for download from the EasyLanguage
Library at www.tradestationworld.com.
--Ramesh Dhingra
Director, EasyLanguage Consulting
TradeStation Technologies, Inc. (formerly Omega Research, Inc.)
a wholly owned subsidiary of TradeStation Group, Inc.
www.TradeStation.com
GO BACK
 METASTOCK: SUPPORT AND RESISTANCE LEVELS
MetaStock 7.2 or higher already includes the MACD histogram as a built-in
indicator. You can use the System Tester, Explorer, or Expert Advisor.
If you have a version earlier than 6.52, you can go to www.equis.com and
download the formula.
To plot last week's highs and lows as support and resistance lines on
the current week, you can use the following formula. To create a formula
in MetaStock 6.52 or higher, select the Indicator Builder from the Tools
menu. Then click "New" and enter the formulas as listed here:
ValueWhen(1,nw,Ref(HighestSince(1,nw,H),-1));

ValueWhen(1,nw,Ref(LowestSince(1,nw,L),-1));
--Scott Brown
Equis International
www.equis.com
GO BACK
 NEUROSHELL TRADER: FUZZY PATTERNS
You can easily implement the trading system with fuzzy pattern indicators
described by Ward Systems Group's own Marge Sherald in her article "Trading
Fuzzy Patterns" elsewhere in this issue by using the extra cost add-on
called Fuzzy Pattern Recognizer in NeuroShell Trader.
First, select "New Chart …" from the File menu and choose a stock of
interest on the appropriate wizard screen.
The next step is to create the fuzzy pattern indicators. Select "New
Indicator …" from the Insert menu and use the Indicator Wizard to create
each of the following indicators. Rename the indicators to BuyLongFuzzy2
and SellShortFuzzy2 as appropriate:
BUY LONG FUZZY2:

     Fuzzy2(Close, 1, -2, 10, 5)

SELL SHORT FUZZY2

    Fuzzy2(Close,  2, 0, 10, 5)
To create the trading system based on the fuzzy patterns, select
"New Trading Strategy …" from the Insert menu and enter the following long
and short entry conditions in the appropriate locations of the Trading
Strategy Wizard:
BUY LONG CONDITIONS:

     A>B(BuyLongFuzzy2(Close,1,-2,10,5),0.3)

SELL SHORT CONDITIONS:

     A>B(BuyShortFuzzy2(Close,2,0,10,5),0.07)
As Sherald suggests in the article, use the genetic algorithm optimizer
in the Trading Strategy Wizard to maximize profit.
Users of NeuroShell Trader can go to the STOCKS & COMMODITIES section
of the NeuroShell Trader free technical support website to download a sample
chart that includes the fuzzy pattern recognition trading strategy discussed
in the article.
--Steve Ward, Ward Systems Group, Inc.
301 662-7950, sales@wardsystems.com
www.neuroshell.com
GO BACK
 NEUROSHELL TRADER: SUPPORT AND RESISTANCE LEVELS
The technique that Thom Hartle describes in this issue for plotting
support and resistance levels can be implemented in the NeuroShell Trader
by combining a few of the 800+ technical indicators plus a couple of indicators
that we've designed to specifically attack this problem.
In the Trading Strategy Wizard you need to structure your entry conditions
based on the values and slope of the difference between the MACD and the
MACD signal. In addition, we recommend placing a buy stop at the previous
week's high or low based on the position entry type. You may want to add
additional leeway to the stop order, or better yet -- let the genetic algorithm
select the best leeway by using the professional version of the NeuroShell
Trader.
To enter a long position, select the following entry conditions:
A>B(Sub(MACD,MACD Signal), 0)

A>B(LinTimeReg Slope(Sub(MACD,MACD Signal),3),0)
with a stop price of WeekHigh(Date,High,1). See Figure 1.
To enter a short position, select the following entry conditions:
A<B(Sub(MACD,MACD Signal), 0)

A<B(LinTimeReg Slope(Sub(MACD,MACD Signal),3),0)
with a stop price of WeekLow(Date,Low,1).
Users of NeuroShell Trader can go to the STOCKS & COMMODITIES section
of the NeuroShell Trader free technical support website to download a sample
chart and indicators.
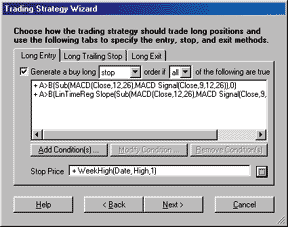
Figure 1: NEUROSHELL TRADER, SUPPORT AND RESISTANCE. Here's how
to input the long entry conditions and stop price for a long entry.
--Marge Sherald, Ward Systems Group, Inc.
301 662-7950, sales@wardsystems.com
www.neuroshell.com
GO BACK
 Wealth-Lab: SUPPORT AND RESISTANCE LEVELS
The article "Cueing Off Support And Resistance Levels" by Thom Hartle
in this issue uses weekly highs and lows to determine areas of support
and resistance on the daily chart. You can easily access data for the weekly
scale from within a daily chart in Wealth-Lab.
The script presented here obtains the highs and lows of the previous
week and plots them on the daily chart. It also plots the difference between
the MACD and its signal line (Figure 2).
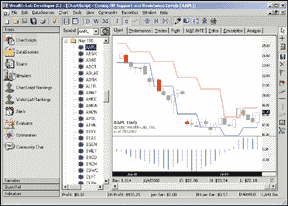
FIGURE 2: Wealth-Lab, support and resistance. Here is
a sample chart in Wealth-Lab. The script presented in this Traders' Tip
obtains the highs and lows of the previous week and plots them on the daily
chart. It also plots the difference between the MACD and its signal line.
When daily prices cross above the previous week's high, and the
MACD histogram is rising, the script colors the bar green. When the reverse
condition is met, the script colors the bar red.
var Bar, wh, wl, MACDSignal, Diff, MACDPane: integer;

{ Get Last Week's High/Low }

SetScaleWeekly;

wh := OffsetSeries( #High, -1 );

wl := OffsetSeries( #Low, -1 );

RestorePrimarySeries;

{ Transform weekly data back to daily scale }

wh := DailyFromWeekly( wh );

wl := DailyFromWeekly( wl );

{ Plot them }

PlotSeries( wh, 0, 955, #Thick );

PlotSeries( wl, 0, 559, #Thick );

{ Get Difference between MACD and Signal Line }

MACDSignal := EMASeries( MACDSeries( #Close ), 9 );

Diff := SubtractSeries( MACDSeries( #Close ), MACDSignal );

{ Plot it }

MACDPane := CreatePane( 100, false, true );

HideVolume;

PlotSeries( Diff, MACDPane, #Navy, #Histogram );

{ Highlight bars }

for Bar := 20 to BarCount - 1 do

begin

  SetBarColor( Bar, 666 );

  if CrossOver( Bar, #Close, wh ) then

    if GetseriesValue( Bar, Diff ) > GetSeriesValue( Bar - 1, Diff ) then

      SetBarColor( Bar, #Green );

  if CrossUnder( Bar, #Close, wl ) then

    if GetseriesValue( Bar, Diff ) < GetSeriesValue( Bar - 1, Diff ) then

      SetBarColor( Bar, #Red );

end;
--Dion Kurczek, Wealth-Lab, Inc.
www.wealth-lab.com
GO BACK
 Wealth-Lab: Fuzzy Patterns
Since Wealth-Lab is a complete programming environment, you can program
your own fuzzy logic system at the Wealth-Lab.com website or using the
Wealth-Lab Developer 2.1 desktop product.
We've programmed a fuzzy logic script based on Marge Sherald's article
in this issue, "Trading Fuzzy Patterns." The script uses custom functions
to interpret the RisesSharply, Rises, Flat, Falls, and FallsSharply rules
used in the fuzzy logic engine (Figure 3). A final custom function,
Fuzzy, accepts two rules, as well as the pattern length and the calibration
factor to determine if a move should be considered sharp. The fuzzy function
returns a value between zero and 1.

FIGURE 3: Wealth-Lab, FUZZY PATTERNS. Fuzzy signals are displayed
on a Wealth-Lab chart, where custom functions interpret rules used in the
fuzzy logic engine.The script colors the long bars blue and the short bars
red.
The script then proceeds to use the FuzzyLong and FuzzyShort rules
as described in the article. Long entries are dentified by a rise (1) followed
by a sharp fall (-2). Short entries are identified by a sharp rise (2)
followed by a flat period (0). The script displays the fuzzy signals on
the chart and colors long bars blue and short bars red.
You can execute the script directly from the Wealth-Lab.com website.
Go to https://www.wealth-lab.com and click the "ChartScripts" link in the
main menu. Click the "Public ChartScripts" submenu and you'll see the "fuzzy
logic" script in the list.
--Dion Kurczek, Wealth-Lab, Inc.
www.wealth-lab.com
GO BACK
 NeoTicker: SUPPORT AND RESISTANCE LEVELS
All the indicators required to implement the concept presented in "Cueing
off Support And Resistance Levels" by Thom Hartle in this issue are already
available in NeoTicker. In fact, NeoTicker can help you enhance the support
and resistance analysis by crossing multiple time frames within a chart.
The first chart is an intraday S&P futures chart with the previous
day's high and previous day's low acting as support and resistance. To
create this chart, load a data series with 15-minute bars. Click on the
data series to select it, and then right-click to choose "Add Indicator"
from the popup menu. This will bring up the Add Indicator window; from
there, you can select the PrevDay High indicator and press the Apply button.
This will plot a horizontal line marking the previous day's high, which
acts as the resistance line.
To change the color of the line, click on the line to select it, and
then right-click to choose "Edit." In the lower half of the Edit Indicator
window, click on the visual tab. Click on the dropdown arrow under the
color column. Select the color green from the dropdown color selection.
Now you can add the PrevDay Low indicator as the support line by repeating
the "add indicator" procedure as you just did for the PrevDay High indicator.
This time, change the color to red. The result is shown in Figure 4.
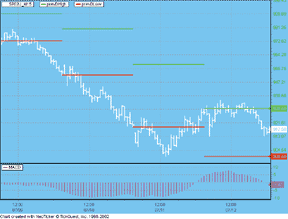
FIGURE 4: NEOTICKER, SUPPORT AND RESISTANCE. Here's
an intraday S&P futures chart with the previous day's high and previous
day's low acting as support and resistance, as described in Thom Hartle's
article in this issue.
The second chart is an S&P cash index daily chart with the previous
week's high and previous week's low as support and resistance lines. First,
load a chart with daily bar size of 1. Next step is to select the data
series and add the indicators. This time, you will add the PrevWeek High
and PrevWeek Low indicators just like we did with the first chart. The
result is shown in Figure 5.
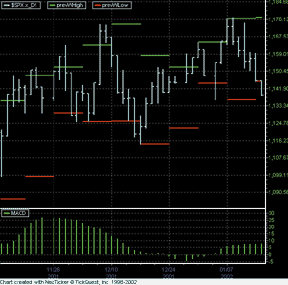
FIGURE 5: NEOTICKER, SUPPORT AND RESISTANCE. This time,
an S&P cash index daily chart is shown with the previous week's high
and previous week's low as support and resistance lines.
The third chart is a Dow Jones 30 cross time frame chart. To create
this chart, first add a Dow Jones data series with 15-minute bars. Next
you can add another data series on the same chart with 120-minute bars.
To make the chart more readable, you can change the chart style to "Dot"
and the color to light blue. This time you will add all four indicators,
PrevDay High, PrevDay Low, PrevWeek High and PrevDay Low to the data series.
The result is shown in Figure 6.
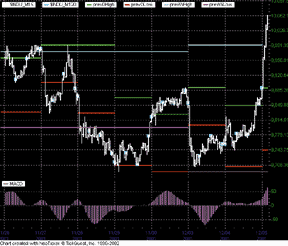
FIGURE 6: NEOTICKER, SUPPORT AND RESISTANCE. NeoTicker
can help you enhance the support and resistance analysis by crossing multiple
time frames within a chart. Here, a Dow Jones 30 cross time frame chart
is shown.
These sample charts are also available for download from the NeoTicker
Yahoo user group at https://groups.yahoo.com/group/neoticker/.
There are also additional support and resistance indicators built into
NeoTicker. For example, NeoTicker offers floor pivot indicators such as
PrevDay Average and PrevDay Support/Resistance; and higher time frame references
such as PrevMonth High and PrevMonth Low. You can also create your own
with our formula language or scripting language.
--Kenneth Yuen, TickQuest Inc.
www.tickquest.com
GO BACK
 Investor/RT: SUPPORT AND RESISTANCE LEVELS
In "Cueing Off Support And Resistance Levels" in this issue, Thom Hartle
discusses how to use support and resistance levels in your charting.
Bands can be added to Investor/RT daily charts showing the previous
week's high and low at each bar. These bands represent the support and
resistance levels discussed in the article. Figure 7 depicts
a daily candlestick chart of INTC with the previous weekly support and
resistance bands added in blue.
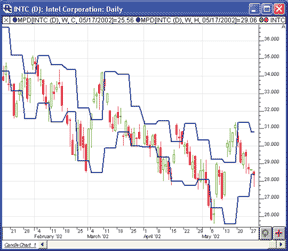
Figure 7: Investor/RT, SUPPORT AND RESISTANCE. Here is an Investor/RT
daily candlestick chart of INTC overlaid with support and resistance bands
representing previous weekly highs and lows.
These bands are created using the mixed periodicity data (MPD) indicator
in Investor/RT. This indicator allows you to overlay data of any periodicity
(tick, one-minute, 30-minute, daily, weekly, and so on) on any chart of
any other periodicity. In addition to being able to mix the periodicity,
the user also has the option to mix the ticker symbol and/or the data source.
The preferences used to construct the upper band can be seen in Figure
8.
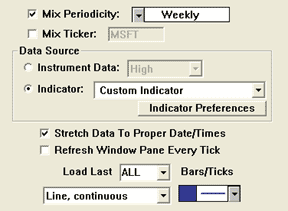
Figure 8: Investor/RT, SUPPORT AND RESISTANCE. Here are the suggested
preference settings for the mixed periodicity data (MPD) indicator, which
is used to construct upper (support) band.
Note that the periodicity in this case is set to "weekly." In order
to reference the previous weekly highs and lows, we must create two custom
indicators on which to base our two MPD bands. The first custom indicator
will have the following syntax in order to reference the previous week's
highs:
HI.1
The second custom indicator will have the following syntax in order
to reference the previous week's lows:
LO.1
In the MPD preferences, simply select the data source "Indicator," then
select "Custom Indicator" from the list. Click on "Indicator Preferences"
and choose the custom indicators you've created for the previous week's
highs and lows. You'll have to add two instances of MPD to the chart: one
for the high band and one for the low band.
The MPD indicator is very flexible and has many applications, including
equi-spaced tick charts, daily data on intraday charts, daily volume on
intraday charts, multiperiodicity scanning and backtesting, and more. For
more information on MPD, visit https://www.linnsoft.com/tour/techind/mpd.htm.
--Chad Payne, Linn Software
800-546-6842, info@linnsoft.com
www.linnsoft.com
GO BACK
 TradingSolutions: SUPPORT AND RESISTANCE LEVELS
In his article "Cueing Off Support And Resistance Levels" in this issue,
Thom Hartle discusses the merits of using the lowest low and the highest
high of the previous week as support and resistance for the current week.
This is especially useful if you believe trading behavior over contiguous
days may be different from behavior over days separated by weekends.
TradingSolutions includes built-in functions for calculating the lowest
low and highest high over a given number of bars. However, custom functions
are needed to preserve the high and low of the previous week.
A good approach is to first calculate the high for the current week,
as follows:
High For Current Week

Name: CurWeekHigh

Inputs: High

If (IsFirstDayOfWeek ( ), High, Max (High, Prev (1)))
We can now use this function to calculate the high for the previous
week by holding the last value of the previous week on the first day of
each new week. In other words, every Monday, get the High For Current Week
from the previous Friday, then hold it.
High For Previous Week

Name: PrevWeekHigh

Inputs: High

If (IsFirstDayOfWeek ( ), Lag (CurWeekHigh (High), 1), Prev (1))
The lowest low for the previous week can be calculated in the same
way using the low and changing the Max function to a Min. These functions
are available in a function file that can be downloaded from the TradingSolutions
website in the Solution Library section. A sample chart is shown in Figure
9.
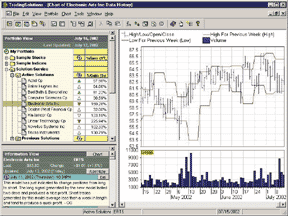
Figure 9: TradingSolutions, SUPPORT AND RESISTANCE. Here's a
sample chart displaying the high for the previous week and the low for
the previous week relative to current prices.
As with most indicators, functions such as High For Previous Week can make
good inputs to neural network predictions. If used directly, you will want
to set the preprocessing to "None," since the value does not change on
each bar. However, since these functions are used for checking the support
and resistance levels of current prices, a more effective approach would
be to use the Percent Difference function to compare the High to the High
For Previous Week.
--Gary Geniesse, NeuroDimension, Inc.
800 634-3327, 352 377-5144
www.tradingsolutions.com
GO BACK
 Wave Wi$e: PPORT AND RESISTANCE LEVELS
The following Wave Wi$e formulas calculate weekly support and resistance
levels, as described in Thom Hartle's article in this issue.
Figure 10 shows the weekly support/resistance as bands on the
Dow Jones Industrial Average price action.
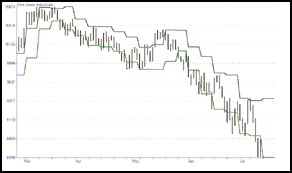
Figure 10: Wave Wi$e, SUPPORT AND RESISTANCE. Here's
a sample Wave Wi$e chart demonstrating weekly support/resistance as bands
on the Dow Jones Industrial Average.
A: DATE @TC2000(C:\TC2000V3\Data,DJ-30,Dow Jones Industrials,DB)

B: HIGH

C: LOW

D: CLOSE

E: OPEN

F: VOL

G: extend  @EXTEND(A, 5, 0)  'EXTEND DATA INTO FUTURE

H: count @TCOUNT(A, 1) 'COUNT DAYS IN EACH WEEK

I: wkHi  @IF(COUNT[-1] >0, @MAX(HIGH[-1],COUNT[-1])) 'HIGH THIS WEEK

J: wkLo  @IF(COUNT[-1] >0, @MIN(LOW[-1],COUNT[-1])) 'LOW THIS WEEK

K: fwHi @LAST(WKHI) 'LAST WEEK HI INTO THIS WEEK

L: fwLo @LAST(WKLO) 'LAST WEEK LOW INTO THIS WEEK

M: chart @CHART(1) 'DISPLAY CHART

N:  ' ==========End Formulas
--Peter Di Girolamo, Jerome Technology
908 369-7503, jtiware@aol.com
https://members.aol.com/jtiware
GO BACK
TradeStation (TradeStation Technologies), MetaStock (Equis International),
NeuroShell Trader (Ward Systems Group), Wealth-Lab (Wealth-Lab, Inc.),
NeoTicker (TickQuest Inc.), Investor/RT (Linn Software), TradingSolutions
(NeuroDimension, Inc.), WAVE WI$E Market Spreadsheet (Jerome Technology)
All rights reserved. © Copyright 2002, Technical
Analysis, Inc.
Return to September 2002 Contents
TradeStation: SUPPORT AND RESISTANCE LEVELS
MetaStock: SUPPORT AND RESISTANCE LEVELS
NeuroShell TRADER: FUZZY PATTERNS
NeuroShell TRADER: SUPPORT AND RESISTANCE LEVELS
Wealth-Lab: SUPPORT AND RESISTANCE LEVELS
Wealth-Lab: FUZZY PATTERNS
NeoTicker: SUPPORT AND RESISTANCE LEVELS
Investor/RT: SUPPORT AND RESISTANCE LEVELS
TradingSolutions: SUPPORT AND RESISTANCE LEVELS
WAVE WI$E: SUPPORT AND RESISTANCE LEVELS
![]() TRADESTATION: SUPPORT AND RESISTANCE LEVELS
TRADESTATION: SUPPORT AND RESISTANCE LEVELS
![]() METASTOCK: SUPPORT AND RESISTANCE LEVELS
METASTOCK: SUPPORT AND RESISTANCE LEVELS
![]() NEUROSHELL TRADER: FUZZY PATTERNS
NEUROSHELL TRADER: FUZZY PATTERNS
![]() NEUROSHELL TRADER: SUPPORT AND RESISTANCE LEVELS
NEUROSHELL TRADER: SUPPORT AND RESISTANCE LEVELS


