CHARTING
Two Of A Kind
Eve & Eve Double Bottoms
by Thomas Bulkowski
Here's a look at one of the four combinations of double bottoms.
You may be familiar with double bottoms, but have you ever heard of an Eve & Eve double bottom? I hadn't heard of them myself until a few years ago, when I was researching my latest book, Trading Classic Chart Patterns. After discovering the Adam & Eve combinations of double bottoms on Hardrightedge.com, I expanded their findings to include all four types: Eve & Eve, Adam & Adam, Eve & Adam, and Adam & Eve. I'll discuss the latter three types in future articles. This article will focus on the Eve & Eve double bottom.
IDENTIFICATION
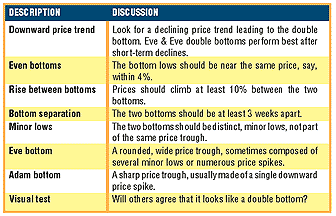
First, some definitions. Figure 1 shows identification guidelines for double bottoms. Start with a declining price trend leading to the chart pattern. For the best performance, choose a decline that is either long-term (over six months) or short-term (up to three months). An intermediate-term decline (three to six months) leading to an Eve & Eve double bottom suggests underperformance after the breakout.
Occasionally, double bottoms will form at the end of the corrective phase of a measured move up. What does that mean? Think of a stairstep pattern: a rise, retrace, and then another rise. The double bottom may form during the retrace and signal a trend change for the second leg up.
The two bottoms should not vary much in price. For statistical purposes, I limited the variation to 4% or less, but in normal trading, I usually don't measure the difference. As long as the two bottoms look as though they are near the same price, you should be fine.
The rise between bottoms should be at least 10%, but 20% is the classic benchmark, measured from low to high. Again, this is not critical. In trading, I don't measure the rise.
The two bottoms, measured from when the day prices reach the lowest low, should be at least three weeks apart (a month apart is the classic measure). If the bottoms are closer together than this, you might be looking at what I refer to as a horn (one week between bottoms on the weekly scale) or a pipe (no separation) chart pattern.

FIGURE 1: GUIDELINES. Here are the identification guidelines for double bottoms.
...Continued in the November 2002 issue of Technical Analysis of STOCKS & COMMODITIES
Excerpted from an article originally published in the November 2002 issue of Technical Analysis of STOCKS & COMMODITIES magazine. All rights reserved. © Copyright 2002, Technical Analysis, Inc.