Q&A
Explore Your Options
| Got a question about options? Tom Gentile is the chief options strategist at Optionetics (www.optionetics.com), an education and publishing firm dedicated to teaching investors how to minimize their risk while maximizing profits using options. To submit a question, post it on the STOCKS & COMMODITIES website at Message-Boards. Answers will be posted there, and selected questions will appear in future issues of S&C. | 
Tom Gentile of Optionetics |
VOLATILITY INDEX
Tom, I have heard of using the volatility index (VIX) as a way of predicting overall market movement. Can you explain this to me, along with some ideas on how to trade the VIX in the markets? - Fred M.
The VIX is a measure of nervousness among traders. The VIX is a chartable indicator, and when it drops to 20% or lower, it means that the markets are calm and have a positive outlook for the future. A high VIX, above 35%, means that the markets are nervous, indicating the future outlook is uncertain. They say among traders that when the VIX is high, it's time to buy, and when the VIX is low, it's time to go. This is a sentiment statement that means you want to move opposite to the crowd. The idea is that when everything looks too good to be true (low VIX), trouble is likely to come. It also means when panic sets in (high VIX), it could be the best time to buy.
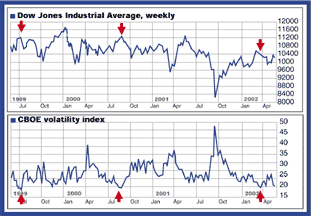
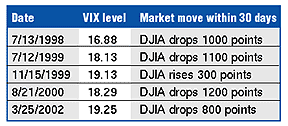
Now it's hard to say how high is "high," but I do know that when we get to a low below 20%, it usually indicates that a correction in the market is due. Over the last five years as I have tracked the VIX, the market has corrected within 30?60 days after the VIX goes below 20%. Figure 1 is a chart of the Dow Jones Industrial Average (DJIA) and the VIX. Arrows indicate the times when the VIX dropped below 20%. The additional table (Figure 2) shows exactly what happened to the markets within the 30 days following the VIX dropping to 20%.

FIGURE 1: THE VOLATILITY INDEX AND THE DJIA

FIGURE 2: What happens in the month following a VIX drop below 20?
According to the table, four of the last five times the VIX fell below 20% resulted in a market correction 30 days later. There was one time the markets actually moved higher, but no system is 100% correct. One way to trade the VIX is simply to buy index put options whenever the VIX trades below 20%. When the VIX is this low, options in general are cheap, making it a safe bet to buy them. Because the markets generally move within the next 30-60 days, I like options with at least 60 days to expiration. This way, you are able to stay in the trade for the duration of the move.
There is little chance we will see a low VIX in the near future. So far this fall the US stock market has been more volatile than ever before. It is rare to see the VIX, also known as the market's fear gauge, remain above 40% for a prolonged period of time, but as of this writing [September 2002], the VIX has been trading above 40% for nearly a month - extraordinarily high.
BUYING CALLS
I heard somewhere that the best time to buy calls is near the end of October, and the best time to buy puts is just after April. Have you heard of this? - Pete T.
I have researched each of these statements, looking at buying index call options near the end of October and buying index put options after April 15 (tax day). The markets often rise after October, mainly due to the lifting of the downward pressure from the month before. And yes, I have also seen that the markets typically fall off during April as a correction. Now the real question is, which one offers a better trade? While October through December may look like a great trade to the upside, the problem is that the options premiums are usually quite high after a drop in the markets. If October was a big down month, then you would expect to pay two or three times more in option premiums than in September, due to the volatility spike. In a rising market, however, options premiums are usually low, meaning that you are getting a better price for your put options if you intend to fade the market to the downside. Historically, more money is made buying outright put options in a correction than buying outright call options in a bounce.
Return to November 2002 Contents
Originally published in the November 2002 issue of Technical Analysis of STOCKS & COMMODITIES magazine. All rights reserved. © Copyright 2002, Technical Analysis, Inc.