November 2002
TRADERS' TIPS
You can copy these formulas and programs for easy use in your spreadsheet or analysis software. Simply "select" the desired text by highlighting as you would in any word processing program, then use your standard key command for copy or choose "copy" from the browser menu. The copied text can then be "pasted" into any open spreadsheet or other software by selecting an insertion point and executing a paste command. By toggling back and forth between an application window and the open Web page, data can be transferred with ease.
This month's tips include formulas and programs for:
or return to November 2002 Contents
![]() TRADESTATION:
AFFINE GEOMETRY
TRADESTATION:
AFFINE GEOMETRY
In "Affine Geometry Of The Markets" in this issue, author Viktor Likhovidov describes how to calculate the projected affine price given the start and end points of a trendline.
Here, we'll present the EasyLanguage code for an affine price indicator based on Likhovidov's ideas. The way the indicator is written, the start and end points of the trendlines are passed in as inputs to the indicator, and the actual input values used are shown in the chart. Note that each point is specified by a date, a time, and a price. (Another way of writing the indicator would be to obtain the start and end points by querying manually drawn trendlines.) The price multiplier and price shift values are also passed in as inputs.
The sample TradeStation chart in Figure 1 illustrates the affine
price indicator as applied to a five-minute bar chart for Microsoft, once
for an uptrend (the yellow line segment labeled up) and once for a downtrend
(the cyan line segment labeled down).

FIGURE 1: TRADESTATION, AFFINE GEOMETRY. Here's a sample TradeStation chart illustrating the affine price indicator as applied to a five-minute bar chart of Microsoft.
Indicator: Affine Price
inputs:
 TLStartPrice( 100 ),
 TLStartDate( 011231 ), { YYMMDD }
 TLStartTime( 1300 ), { HHMM }
 TLEndPrice( 110 ),
 TLEndDate( 020131 ), {YYMMDD }
 TLEndTime( 1300 ), { HHMM }
 PriceMultiple( 100 ),
 PriceShift( 1000 ),
 Price( Close ) ;
variables:
 TLStartDate_EL
  ( iff( IntPortion( TLStartDate / 10000 ) > 50,
  TLStartDate, TLStartDate + 1000000 ) ),
 TLEndDate_EL
  ( iff( IntPortion( TLEndDate / 10000 ) > 50,
  TLEndDate, TLEndDate + 1000000 ) ),
 TLStartBar( 0 ),
 TLEndBar( 1000000 ),
 Base( 0 ),
 Slope( 0 ),
 AffinePriceRaw( 0 ),
 AffinePriceAdjusted( 0 ) ;
if TLStartBar = 0
 and Date = TLStartDate_EL
 and Time = TLStartTime
then
 TLStartBar = CurrentBar ;
if TLEndBar = 1000000
 and Date = TLEndDate_EL
 and Time = TLEndTime
then
 TLEndBar = CurrentBar ;
if CurrentBar > TLEndBar then
 begin
 Base = TLEndBar - TLStartBar ;
 if Base <> 0 then
  Slope = ( TLEndPrice - TLStartPrice ) / Base ;
 AffinePriceRaw = ( Price - TLStartPrice )
  - Slope * ( CurrentBar - TLStartBar ) ;
 AffinePriceAdjusted =
  AffinePriceRaw * PriceMultiple + PriceShift ;
 Plot1( AffinePriceAdjusted ) ;
 end ;
This indicator code will be available for download from the
EasyLanguage Exchange on www.tradestationworld.com.
--Ramesh DhingraGO BACK
Director, EasyLanguage Consulting
TradeStation Technologies, Inc. (formerly Omega Research, Inc.)
a wholly owned subsidiary of TradeStation Group, Inc.
www.TradeStation.com , www.TradeStationworld.com
![]() METASTOCK:
AFFINE GEOMETRY
METASTOCK:
AFFINE GEOMETRY
The formula given in "Affine Geometry Of The Markets" by Viktor Likhovidov in this issue can be easily recreated in MetaStock 6.52 or higher. To create a formula in MetaStock, select Indicator Builder from the Tools menu, click New, enter the code for the formula, and then click OK. Repeat for the remaining formulas.
A single formula can be used to plot the rising and falling transforms.
It prompts you for two points on the trendline. For both points, you must
input a date and a time. If you're working in an end-of-day chart,
leave the time prompts at zero. You can also input a scaling factor to
accentuate the curve ("slope scaling factor") and shift the
result to prevent negative numbers ("display shift value").
sx:=Input("date of first point [ mmddyyyy ]",1,12350000,1032000);
sxt:=Input("intraday time of first point[ 24 hour - hhmm ]",0,2460,0);
ex:=Input("date of second point [ mmddyyyy ]",1,12350000,1032001);
ext:=Input("intraday time of second point[ 24 hour - hhmm ]",0,2460,0);
prs:=Input("scaling factor for slope calculation",1,100000,1);
ops:=Input("shift value for affine display",0,100000,0);
sdt:= (Month()=Int(sx/1000000)) AND
(DayOfMonth()=Rnd(Frac(Int(sx/10000)/100)*100)) AND
(Year()=Rnd(Frac(sx/10000)*10000)) AND
(Hour()= Int(sxt/100)) AND
(Minute()=Rnd(Frac(sxt/100)*100));
edt:=Month()=Int(ex/1000000) AND
DayOfMonth()=Rnd(Frac(Int(ex/10000)/100)*100) AND
Year()=Rnd(Frac(ex/10000)*10000) AND
(Hour()= Int(ext/100)) AND
(Minute()=Rnd(Frac(ext/100)*100));
rise:=LastValue((ValueWhen(1,edt,C)-ValueWhen(1,sdt,C))*prs);
run:=LastValue(ValueWhen(1,edt,Cum(1))-ValueWhen(1,sdt,Cum(1)));
sl:=rise/run;
tr:=((C-LastValue(ValueWhen(1,sdt,C)))-(Cum(1)-LastValue(ValueWhen(1,sdt
,Cum(1))))*sl);
tr+ops
--William Golson, Equis International
www.equis.com
![]() METASTOCK:
FISHER TRANSFORM
METASTOCK:
FISHER TRANSFORM
The indicator described in "Using The Fisher Transform" by John Ehlers in this issue can be easily recreated in MetaStock 6.52 or higher. To create a formula in MetaStock, select Indicator Builder from the Tools menu, click New, enter the code for the formula, and then click OK. Repeat for the remaining formulas.
This indicator has two formulas. One plots the Fisher transform and its signal line. The second plots the transform and its rate of change multiplied by 10. The formulas are:
Transform with signal:
pr:=(H+L)/2;
len:=10;
maxh:=HHV(pr,len);
minl:=LLV(pr,len);
val1:=.33*2*((pr-minl)/(maxh-minl)-.5)+.67*PREV;
value1:=If(val1>.99,.999,If(val1<-.99,-.999,val1));
fish:=.5*Log((1+value1)/(1-value1))+.5*PREV;
fish;
Ref(fish,-1);
Transform with Rate of Change:
pr:=(H+L)/2;
len:=10;
maxh:=HHV(pr,len);
minl:=LLV(pr,len);
val1:=.33*2*((pr-minl)/(maxh-minl)-.5)+.67*PREV;
value1:=If(val1>.99,.999,If(val1<-.99,-.999,val1));
fish:=.5*Log((1+value1)/(1-value1))+.5*PREV;
fish;
10*ROC(fish,1,$)
To plot the indicator, locate it in MetaStock Indicator Quicklist,
then click and drag it onto the desired chart.
If you have any questions creating an indicator, call us at 801 265-9998 or e-mail us at support@equis.com.
--William Golson, Equis InternationalGO BACK
www.equis.com
![]() eSIGNAL: FISHER TRANSFORM
eSIGNAL: FISHER TRANSFORM
This eSignal formula plots the Fisher transform. A sample chart can be seen in Figure 2.

FIGURE 2: eSIGNAL, FISHER TRANSFORM. This plots the Fisher transform indicator on a historical chart for the US 30-year Treasury bond. This is an example of a custom formula that can be written and modified in any text editor for use in eSignal.
/**************************************************************************
Copyright © eSignal, a division of Interactive Data Corporation.
2002. All rights reserved. This sample eSignal Formula Script (EFS) was
created for use by authorized eSignal users and eSignal is not responsible
for the functionality or results of this formula. Neither eSignal nor its
employees or affiliates recommend any specific approach to investing in
securities
**************************************************************************/
GO BACKfunction preMain() { setStudyTitle("Fisher XForm"); setCursorLabelName("Fisher", 0); setCursorLabelName("Trigger", 1); setDefaultBarFgColor(Color.red, 0); setDefaultBarFgColor(Color.blue, 1); setDefaultBarThickness(2,0); setDefaultBarThickness(2,1); } var Value1_1 = 0; var Fish_1 = 0 function main(Len) { if (Len == null) Len = 10; var Price = (high() + low()) / 2; var MaxH = 0; var MinL = 0; var Fish = 0; var i; var Value1 = 0; var temp; for(i = 0; i < Len; i++) if(i == 0){ MaxH = high(); MinL = low() }else{ MaxH = Math.max(MaxH, high(-i)); MinL = Math.min(MinL, low(-i)); } Value1 = .33 * 2 * ((Price - MinL) / (MaxH - MinL) - .5) + .67 * Value1_1; if(Value1 > .99) Value1 = 9.999; if(Value1 < -.99) Value1 = -9.999; Fish = .5 * Math.log((1 + Value1) / (1 - Value1)) + .5 * Fish_1; Value1_1 = Value1; if(getBarState() == BARSTATE_NEWBAR) { temp = Fish_1; Fish_1 = Fish; } return new Array(Fish,temp); } /**********************************************************************/--eSignal, a division of Interactive Data Corp.
800 815-8256, www.esignal.com
![]() AIQ: FISHER TRANSFORM
AIQ: FISHER TRANSFORM
Here is the code for use in AIQ's Expert Design Studio based on John Ehlers' article in this issue, "Using The Fisher Transform."
! November Traders Tips TASC Nov. 2002
! Article "Using The Fisher Transform" by John F. Ehlers
! This code is provided by AIQ as is for educational purposes only.
! No warranty of results or accuracy of authors text is implied.
Price is ([high] + [low]) / 2.
MaxH is Highresult(price, 10).
MinL is Lowresult(price, 10).
NormalizedPrice is 2 * ((Price - MinL) / (MaxH - MinL) - 0.5).
NormalPriceESA is ExpAvg(NormalizedPrice,3).
ValueOne is iff(NormalPriceESA > 0.999, 0.99,iff( NormalPriceESA < -0.999, -0.99, NormalPriceESA )).
FisherXForm is Ln((1+ ValueOne) / (1-ValueOne)).
Fish is ExpAvg(FisherXForm,2).
Fisher is Fish * 10.
Trigger is ValResult(Fish,1).
--AIQ Systems
www.aiq.com
![]() WEALTH-LAB: AFFINE GEOMETRY
WEALTH-LAB: AFFINE GEOMETRY
You can use the following WealthScript code to plot the technique described
by Viktor Likhovidov in "Affine Geometry Of The Markets"
in Wealth-Lab Developer 2.1. A sample chart display is in Figure 3.

FIGURE 3: WEALTH-LAB, AFFINE GEOMETRY. Here is a sample chart of the affine geometry technique in Wealth-Lab. The affine transformations are computed based on the rising and falling trendlines.
You must first draw two manual trendlines on your chart, one for
the rising channel and one for the falling channel. Edit the trendline
objects (by right-clicking on them) and name the rising channel trendline
"Rising" and the falling channel "Falling."
The script given here uses these names to find the trendlines that you
manually drew to compute the affine transformations.
var P0, P1, tgA, pAFF: float;
var Bar, T0, T1, Ris, RisPane, Fal, FalPane: integer;
{ Rising Channel Affine Transformation }
T0 := 0;
T1 := 100;
P0 := TrendLineValue( T0, 'Rising' );
if P0 = 0 then
  raise Exception.Create( 'Trendline named "Rising" not found' );
P1 := TrendLineValue( T1, 'Rising' );
tgA := ( P1 - P0 ) / ( T1 - T0 );
Ris := CreateSeries;
for Bar := 0 to BarCount - 1 do
begin
  pAFF := ( PriceClose( Bar ) - P0 ) - ( Bar - T0 ) * tgA;
  @Ris[Bar] := pAFF;
end;
RisPane := CreatePane( 100, true, true );
PlotSeries( Ris, RisPane, #Green, #Thick );
{ Falling Channel Affine Transformation }
T0 := 0;
T1 := 100;
P0 := TrendLineValue( T0, 'Falling' );
if P0 = 0 then
  raise Exception.Create( 'Trendline named "Falling" not found' );
P1 := TrendLineValue( T1, 'Falling' );
tgA := ( P1 - P0 ) / ( T1 - T0 );
Fal := CreateSeries;
for Bar := 0 to BarCount - 1 do
begin
  pAFF := ( PriceClose( Bar ) - P0 ) - ( Bar - T0 ) * tgA;
  @Fal[Bar] := pAFF;
end;
FalPane := CreatePane( 100, false, true );
PlotSeries( Fal, FalPane, #Red, #Thick );
--Dion Kurczek, Wealth-Lab, Inc.
www.wealth-lab.com
![]() WEALTH-LAB: FISHER TRANSFORM
WEALTH-LAB: FISHER TRANSFORM
The Fisher transform described in "Using The Fisher Transform" in this issue by John Ehlers is available as a preprogrammed custom indicator on the Wealth-Lab.com backtesting website, as well as in Wealth-Lab Developer 2.1.
To be sure you have the custom indicator installed into Developer 2.1, select "Community," then "Download ChartScripts" from the main menu.
We've found that the Fisher transform can be very useful for pinpointing entries for short-term trades. The system we present here goes long when the Fisher transform crosses above its signal line from below -4. It exits the long when the indicator crosses above zero. As seen on the chart in Figure 4, the system can capture nice short-term gains on the weekly time scale.
FIGURE 4: WEALTH-LAB, FISHER TRANSFORM. Here is a sample chart of the Fisher transform in Wealth-Lab. This system created in Wealth-Lab exits the long when the indicator crosses above zero. The system can capture nice short-term gains on the weekly time scale.
GO BACK{$I 'Fisher'} var FisherPane, Bar, FishMain, FishTrig: integer; FisherPane := CreatePane( 100, true, true ); FishMain := FisherSeries( #Average, 10 ); FishTrig := OffsetSeries( FishMain, -1 ); PlotSeries( FishMain, FisherPane, 900, #Thick ); DrawLabel( 'Fisher(Average,10)', FisherPane ); PlotSeries( FishTrig, FisherPane, #Navy, #Thick ); for Bar := 20 to BarCount - 1 do begin if MarketPosition = 0 then begin if CrossOver( Bar, FishMain, FishTrig ) then if @FishMain[Bar - 1] < -4 then BuyAtMarket( Bar + 1, 'Fisher' ); end else begin if CrossOverValue( Bar, FishMain, 0 ) then SellAtMarket( Bar + 1, LastPosition, 'Fisher' ); end; end;--Dion Kurczek, Wealth-Lab, Inc.
www.wealth-lab.com
![]() NEUROSHELL TRADER: FISHER TRANSFORM
NEUROSHELL TRADER: FISHER TRANSFORM
John Ehlers' Fisher transform can be easily implemented in NeuroShell Trader by using the NeuroShell Trader's ability to call external programs. These programs can be written in C, C++, Power Basic (also Visual Basic using one of our add-on packages), and Delphi. We've thus created the Fisher transform that you can download from NeuroShell Trader's free technical support website.
After downloading the custom indicator, you can insert it by doing the
following (Figure 5):

FIGURE 5: NEUROSHELL TRADER, FISHER TRANSFORM. Here's how to add the Ehlers' Fisher and Fisher Trigger using NeuroShell Trader's Indicator Wizard.
Select "New Indicator ..." from the Insert menu.
Select the Custom Indicator category.
Select the Fisher and Fisher Trigger indicators.
Select the parameters as you desire.
Select the Finished button.
After downloading the custom indicator, you can easily insert it
or combine it with any of our 800+ built-in indicators into a chart, prediction,
or trading strategy. In addition, if you decide to use this indicator in
a prediction or a trading strategy, the coefficients can be optimized by
the genetic algorithm built into NeuroShell Trader Professional or NeuroShell
DayTrader Professional. This can provide you with your own custom version
of Ehlers' Fisher transform that works best with your data.
A sample chart is in Figure 6.

FIGURE 6: NEUROSHELL TRADER, FISHER TRANSFORM. Here's a sample NeuroShell Trader chart displaying the Ehlers Fisher and Fisher trigger indicators.
Users of NeuroShell Trader can go to the STOCKS & COMMODITIES
section of the NeuroShell Trader free technical support website to download
a copy of any of the Traders' Tips.
For more information on NeuroShell Trader, visit www.NeuroShell.com.
--Marge Sherald, Ward Systems Group, Inc.
301 662-7950, sales@wardsystems.com
www.neuroshell.com
![]() NEOTICKER: AFFINE GEOMETRY
NEOTICKER: AFFINE GEOMETRY
NeoTicker has a special feature called virtual data series that allows indicators to construct open-high-low-close information as if they are data series.
The affine geometry price indicator (Listing 1) takes a total of five parameters. The first two parameters specify the time and price at point 0 while the next two parameters specify time and price at point 1. The last parameter, offset, is handy if you need to adjust the resulting series away from negative values as described in Viktor Likhovidov's article this issue.
Take a look at the screenshot in Figure 7: By using a trendline that
shows its handles' prices and date-time, you can easily apply the
information in the parameter entry (Figure 8) of the indicator.

FIGURE 7: NEOTICKER, AFFINE GEOMETRY. By using a trendline that shows its handles' prices and date-time, you can easily apply the information in the parameter entry of the indicator.
FIGURE 8: NEOTICKER, AFFINE GEOMETRY. Here's the affine geometry price indicator as displayed in NeoTicker.
You can download this indicator from NeoTicker's Yahoo! user
group in the file area.
LISTING 1
function timedist (dn); // calculate the distance between 2 points in time
var ref, dif, days, overnights;
begin
   ref := heap.real ['d0'];
   dif := dn - ref;
   days := (dif - tq_trunc (dif / 7) * 2);
   overnights := tq_trunc (days);
   if (tq_frac (dn) < tq_frac (ref)) and (tq_trunc (ref) <> tq_trunc (dn)) then
       overnights := overnights + 1;
   result := days - (1 - heap.real ['tr']) * overnights;
end;
function transform (price); // carry out the price transformation usign affine geometry
begin
   result := (price - heap.real ['p0']) -
             timedist (data1.datetime [0]) * heap.real ['tg'] +
             param5.real;
end;
procedure init_heap; // parameter initialization
var d0, d1;
begin
   heap.allocate (1);
   d0 := tq_str2datetime (param2.str);
   d1 := tq_str2datetime (param4.str);
   if d0 < d1 then begin
      heap.real ['d0'] := d0;
      heap.real ['d1'] := d1;
      heap.real ['p0'] := param1.real;
      heap.real ['p1'] := param3.real;
   end else begin
      heap.real ['d0'] := d1;
      heap.real ['d1'] := d0;
      heap.real ['p0'] := param3.real;
      heap.real ['p1'] := param1.real;
   end;
   if itself.tradingtime24hours then
      heap.real ['tr'] := 1
   else
      heap.real ['tr'] := itself.tradingtimeend - itself.tradingtimestart;
   heap.real ['tg'] := (heap.real ['p1'] - heap.real ['p0']) / timedist (heap.real ['d1']);
end;
function AGPrice; // actual indicator function
begin
   if not data1.valid [0] then begin
      itself.successall := false;
      exit;
   end;
   if heap.size = 0 then init_heap;
   itself.plot [1] := transform (data1.open [0]);
   itself.plot [2] := transform (data1.high [0]);
   itself.plot [3] := transform (data1.low [0]);
   itself.plot [4] := transform (data1.close [0]);
end;
--Kenneth Yuen, TickQuest Inc.
www.tickquest.com
![]() NEOTICKER: FISHER TRANSFORMATION
NEOTICKER: FISHER TRANSFORMATION
The Fisher transform indicator is implemented to take two parameters. The first parameter is a formula representing the price to be transformed. You can type in any valid formula as the price to see what effects they have. The second parameter is the period of the transformation.
The screenshot in Figure 9 shows the Fisher transform indicator overlaid by its rate of change, with a comparison to the MACD.

FIGURE 9: NEOTICKER, FISHER TRANSFORM. Here's a sample NeoTicker chart showing the Fisher transform indicator overlayed by its rate of change and compared to the MACD.
You can download this indicator from NeoTicker's Yahoo! user
group under the file area.
LISTING 1
function fisherxform;
var price, maxh, minl, v1, v2, fish;
begin
   if not data1.valid [0] then
   begin
      itself.successall := false;
      exit;
   end;
   price := itself.makeindicator ('f1', 'fml', ['1'], [param1.str]);
   maxh := itself.makeindicator ('f2', 'hhv', ['f1'], [param2.str]);
   minl := itself.makeindicator ('f3', 'llv', ['f1'], [param2.str]);
   if (not price.valid [0]) or
      (not maxh.valid [0]) or
      (not minl.valid [0]) then
   begin
      itself.successall := false;
      exit;
   end;
   v1 := 0.33 * 2 *
         ((Price.value [0] - minl.value [0]) /
          (maxh.value [0] - minl.value [0])
          - 0.5)
         + 0.67 * heap.real ['v2'];
   if v1 > 0.99 then
      v2 := 0.999
   else if v1 < -0.99 then
      v2 := -0.999
   else
      v2 := v1;
   fish := 0.5 * tq_ln ((1 + v2) / (1 - v2)) + 0.5 * heap.real ['fish'];
   itself.plot [1] := fish;
   itself.plot [2] := heap.real ['fish'];
   heap.real ['fish'] := fish;
   heap.real ['v2'] := v2;
end;
A downloadable version of this system script will be available
at the NeoTicker Yahoo! user group as well as the TickQuest website.
--Kenneth Yuen, TickQuest Inc.
www.tickquest.com
![]() INVESTOR/RT: FISHER TRANSFORM
INVESTOR/RT: FISHER TRANSFORM
The Fisher transform (FISH) described by John Ehlers in his article
in this issue is a built-in indicator in the Investor/RT technical indicator
library. Fish can be added without any custom programming by simply selecting
"Fisher transform" from the list of indicators. Figure 10
shows the Fisher transform added as a histogram to a 10-minute candlestick
chart of Intc.
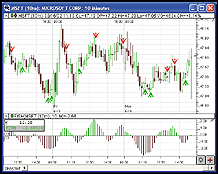
FIGURE 10: INVESTOR/RT, FISHER TRANSFORM. Here's an Investor/RT 10-minute candlestick chart of INTC. The Fisher transform has been added as a histogram to the lower window pane.
Figure 11 shows the preferences used in creating the Fisher transform
plot in Figure 10. A period of 10 was used, with a price of High + Low
/ 2. The period dictates the lookback interval over which the maximum highs
and minimum lows are computed.
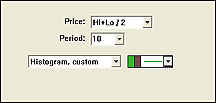
FIGURE 11: INVESTOR/RT, FISHER TRANSFORM. Here are the Investor/RT preferences used for the Fisher transform (FISH) indicator. These settings were used to construct the histogram shown in Figure 10 above.The Fisher transform indicator can be referenced in the Investor/RT RTL (Real Time Language) using the token "Fish." The following syntax would be used in order to find bullish conditions where Fish is below -0.75 and turning up.
Similarly, the following syntax would be used to detect bearish conditions where Fish is above 0.75 and turning down:FISH < -0.75 AND FISH > FISH.1 AND FISH.1 <= FISH.2
Figure 10 also shows signal markers for both the bullish fish (green up arrows) and bearish fish (red down arrows) conditions.FISH > 0.75 AND FISH < FISH.1 AND FISH.1 >= FISH.2
--Chad Payne, Linn Software
800-546-6842, info@linnsoft.com
www.linnsoft.com
![]() TRADINGSOLUTIONS: FISHER TRANSFORM
TRADINGSOLUTIONS: FISHER TRANSFORM
In his article "Using The Fisher Transform," John Ehlers presents a method for using the Fisher transform to detect price reversals.
To implement this in TradingSolutions, first write a function for the
"Value1" used in the formula. Note that the value limits
can be implemented using the minimum and maximum functions. Also, in both
this function and the main Fisher transform function, the moving average
(exponential percent) function can be used to combine the current calculation
with its previous value.
Now, the Fisher transform can be calculated:Fisher Transform Internal Value Name: FishValue Inputs: Price, Length Max (Min (EMA% (Mult (2,Sub (Div (Sub (Price,Lowest (Price,Length)),Sub (Highest (Price,Length),Lowest (Price,Length))),0.5)),33),0.999),-0.999)
An entry/exit system can easily be built around this value by simply testing whether the Fisher transform is crossing its lagged value:Fisher Transform Name: Fish Inputs: Price, Length EMA% (Ln (Div (Add (1,FishValue (Price,Length)),Sub (1,FishValue (Price,Length)))),50)
A sample chart of the Fisher transform displayed in TradingSolutions can be seen in Figure 12.Fisher Transform Crossover System Inputs: Price, Length Enter Long: CrossAbove ( Fish ( Price, Length) , Lag ( Fish ( Price , Length ) , 1 ) ) Enter Short: CrossBelow ( Fish ( Price, Length) , Lag ( Fish ( Price , Length ) , 1 ) )
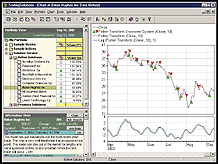
FIGURE 12: TRADINGSOLUTIONS, FISHER TRANSFORM. Here's a sample chart displaying the closing price, the Fisher transform with its lagged value, and an entry/exit signal based on when the Fisher transform crosses its lagged value.
These functions are available in a function file that can be downloaded
from the TradingSolutions website (www.tradingsolutions.com) in the Solution
Library section.
As with many indicators, functions such as the Fisher transform can make good inputs to neural network predictions. If used directly, you will want to set the preprocessing to "None," since the value stays within a specific range, or "Change" if the momentum of the indicator is desired.
--Gary Geniesse, NeuroDimension, Inc.
800 634-3327, 352 377-5144
www.tradingsolutions.com
![]() SMARTRADER: FISHER TRANSFORM
SMARTRADER: FISHER TRANSFORM
Implementation of the Fisher transform as described by John Ehlers in his article in this issue is relatively straightforward and simple in SmarTrader. We found some historical data approximately matching that used in the article.
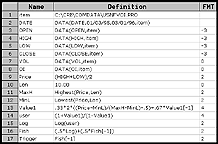
The SmarTrader specsheet is shown in Figure 13. We begin in row 9 by
adding a user row, Price, to calculate the median price. Next, in
row 10, we add a coefficient, Len, to hold the value of the number
of periods to use. Rows 11 and 12 use the preprogrammed Highest and Lowest
functions to determine MaxH and MinL of Price. Both use Len for
the number of periods.
FIGURE 13: SMARTRADER SPECSHEET, FISHER TRANSFORM. Here is the specsheet for the Fisher transform.
Row 13, Value1, is a user row that duplicates the formula
in the article. Note the use of a minus (-) sign for backward reference.
Row 14 is a user row yielding a partial calculation of Fish. Row 15 is
a log function of the above-mentioned user row. Row 16 is a user row that
completes the calculation of Fish. Row 17, Trigger, is a user row
that creates the "delayed-by-one-bar" plot.
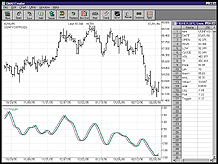
FIGURE 14: SMARTRADER CHART, FISHER TRANSFORM. Here is a sample chart of the Fisher transform in SmarTrader.
--Jim Ritter, Stratagem Software
504 885-7353, Stratagem1@aol.com
![]() TECHNIFILTER PLUS: FISHER TRANSFORM
TECHNIFILTER PLUS: FISHER TRANSFORM
Here is a TechniFilter Plus formula for the Fisher transform discussed
by John Ehlers in his article this issue. The formula uses recursive calculations
for lines 4 and 6.
NAME: Fisher
SWITCHES: multiline   recursive
PARAMETERS: 10
INITIAL VALUE: 0
FORMULA:
[1]: (H+L) / 2
[2]: [1]M&1     { MaxH }
[3]: [1]N&1     { MinL }
[4]: ((.66 * (([1]-[3])/([2]-[3]) - .5)+ .67 * TY1) % (-.999))#(.999) {r}
[5]: .5 * (( 1 + [4] ) / (1 - [4]))U9
[6]: [5] + .5 * TY1 {c}{nFisher} {nc} {r}
[7]: [6]Y1 {c}{nTrigger}
Visit Rtr's website to download this formula as well as program
updates.
--Clay Burch, Rtr Software
919 510-0608, rtrsoft@aol.com
www.rtrsoftware.com
![]() WAVE WI$E MARKETS SPREADSHEET: FISHER TRANSFORM
WAVE WI$E MARKETS SPREADSHEET: FISHER TRANSFORM
The following Wave Wi$e formulas calculate John Ehlers' Fisher
transform.
A: DATE @TC2000(C:\TC2000V3\Data,SP-500,Standard & Poors 500,DB)
B: HIGH
C: LOW
D: CLOSE
E: OPEN
F: VOL
G: Len       10
H: Price     (HIGH+LOW)/2
I: MaxH      @MAX(PRICE,LEN)
J: MinL      @MIN(PRICE,LEN)
K: Val       .33*2*((PRICE-MINL)/(MAXH-MINL)-.5)+.67*@VALUE(VAL[-1]) ;
 @IF(@ABS(VAL)>.99,@SIGN(VAL)*.999,VAL)
L: Fish    .5*@LN((1+VAL)/(1-VAL)) + .5*@VALUE(FISH[-1])
M: Trigger   FISH[-1]
N:            ' ==========End Spreadsheet Formulas
--Peter Di Girolamo, Jerome Technology
908 369-7503, jtiware@aol.com
https://members.aol.com/jtiware
![]() WALL STREET ANALYZER: FISHER TRANSFORM
WALL STREET ANALYZER: FISHER TRANSFORM
Here is a Wall Street Analyzer (WSA) script that implements the Fisher
transform indicator as described by John Ehlers in this issue. To reproduce
it in WSA, go to the Indicators Builder, add an indicator and name it "Fisher
Transform." Then enter this code:
' Fisher transform code
Sub Main()
  Dim MaxH(2001)
  Dim MinL(2001)
  Dim Fish(2001)
  Dim Value1(2001)
  Period = 10
  Price = Divide(Add(GetHigh, GetLow), 2)
  For I = Period to Last
    MaxH(I) = HHV(Price, I - Period + 1, I)
    MinL(I) = LLV(Price, I - Period + 1, I)
  Next
  Value1(Period) = ((Price(Period) - MinL(Period)) / (MaxH(Period) - MinL(Period)) - 0.5)
  If Value1(Period) > 0.99 then Value1(Period) = 0.999
  If Value1(Period) < -0.99 then Value1(Period) = -0.999
  For I = Period + 1 to Last
    Value1(I) = 0.33 * ((Price(I) - MinL(I)) / (MaxH(I) - MinL(I)) - 0.5) + 0.67 * Value1(I - 1)
    If Value1(I) > 0.99 then Value1(I) = 0.999
    If Value1(I) < -0.99 then Value1(I) = -0.999
  Next
  Fish(Period) = Log((1 + Value1(Period)) / (1 - Value1(Period)))
  For I = Period + 1 to Last
    Fish(I) = 0.5 * Log((1 + Value1(I)) / (1 - Value1(I))) + 0.5 * Fish(I - 1)
  Next
  SetIndic(Fish)
End Sub
To implement the Fisher (-1) as a signal line, you can create
another indicator and enter this code:
' Fisher signal line
Sub Main()
  SetIndic(Shift(GetIndic("Fisher transform"), 1))
End Sub
Note: This code will work with Wall Street Analyzer version
1.26 and above. You can download the full version for free at https://www.lathuy.com.
A sample Wall Street Analyzer chart demonstrating the Fisher transform is in Figure 15.
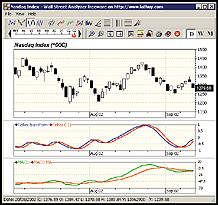
FIGURE 15: WALL STREET ANALYZER, FISHER TRANSFORM. Here is the Fisher transform and the MACD displayed on the same graph in Wall Street Analyzer.
- Frederic D. Collin, Lathuy.comGO BACK
Frederic.Collin@lathuy.com, www.lathuy.com
All rights reserved. © Copyright 2002, Technical Analysis, Inc.
Return to November 2002 Contents


