CHARTING
Quick, Where's The Door?
Adam & Adam Double Bottoms
by Thomas Bulkowski
If you see this type of double bottom, it may mean you need to make a quick exit.
I discussed the Eve & Eve double bottom chart pattern in the November 2002 STOCKS & COMMODITIES. If the Eve & Eve double bottom represents the classic double bottom, then the Adam & Adam must be the new kid on the block. It lacks everything the Eve & Eve double bottom has going for it.
Identification
The guidelines to identify the Adam & Adam double bottom are the same as for the Eve & Eve, so I will not duplicate the guidelines I described last time. You still want to find a bottom pattern after a declining price trend, with two bottoms nearly equal in price and several weeks apart, accompanied by a rise of at least 10% between the bottoms. These guidelines are flexible and arbitrary, but they promote consistency. The key is that the pattern should look like a double bottom.

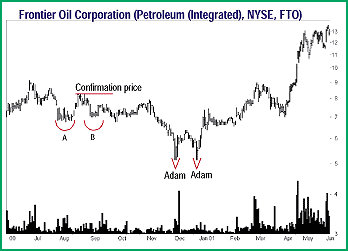
FIGURE 1: ADAM & ADAM DOUBLE BOTTOM. Look for two narrow price bottoms at the same level with a minimum 10% rise between them. Points A and B are Eve-shaped bottoms.
In Figure 1 you see an example of an Adam & Adam double bottom. The Adam & Adam double bottom has twin minor lows that appear narrow and long, sometimes just a couple of one-day downward price spikes. Contrast the Adam bottoms with the Eve bottoms (marked A and B). Those bottoms are shorter, more rounded, and wider. Pattern AB is not an Eve & Eve double bottom. Do you know why? Prices did not confirm the chart pattern before dropping below the lowest bottom low. For this to be a true double bottom, prices must close above the highest high between the two bottoms. That price is called the confirmation or breakout price. This Adam & Adam double bottom confirms in late December.
...Continued in the December 2002 issue of Technical Analysis of STOCKS & COMMODITIES
Excerpted from an article originally published in the December 2002 issue of Technical Analysis of STOCKS & COMMODITIES magazine. All rights reserved. © Copyright 2002, Technical Analysis, Inc.