December 2002
TRADERS' TIPS
You can copy these formulas and programs for easy use in your spreadsheet or analysis software. Simply "select" the desired text by highlighting as you would in any word processing program, then use your standard key command for copy or choose "copy" from the browser menu. The copied text can then be "pasted" into any open spreadsheet or other software by selecting an insertion point and executing a paste command. By toggling back and forth between an application window and the open Web page, data can be transferred with ease.
This month's tips include formulas and programs for:
TRADESTATION: DEVELOPING HOT ZONES
or return to December 2002 Contents
![]() TRADESTATION: DEVELOPING HOT ZONES
TRADESTATION: DEVELOPING HOT ZONES
Massimiliano Scorpio’s article “Developing Hot Zones” in this issue addresses a technique for producing statistical reports on the predictive nature of the key reversal pattern. As the author makes clear, this particular pattern is only one of many possible patterns for study. The author’s goal is to show the reader a process for building statistical reports on any pattern that might be of interest.
These statistical reports are the product of the MSOpenClosePct indicator. This indicator is the focus of the article and most of our comments here address means of improving the EasyLanguage code provided in the article.
The indicator calls a custom function for identifying six open and six close zones. The report then displays the number of bars in the sample, the number of opens in each zone, and the percentage of times an open in a particular zone is followed by a close in a particular zone.
There are some issues with the code that may make it difficult to use as presented in the article, so we are presenting an alternative version here. The key issues are:
1. The divide-by-zero checks in the print statements do not match the actual division calculations in several instances. In addition, the article references the function KRPattern, which is discussed in Scorpio’s December 2001 article in STOCKS & COMMODITIES, “Finding Key Reversals.” We have included the KRPattern code here. (In “Developing Hot Zones,” the same pattern is called SCPattern in the indicator code.) When the divide-by-zero checks are corrected and the function call changed, the code works fine on daily charts.
2. The strategy uses “if LastCalcDate = date,” which will not work on intraday charts. We have changed this conditional statement to “if LastBarOnChart.” This statement works with daily, intraday, volume and tick bars.
3. The code for both the MSOpenScreen function and MSOpenClosePct indicator can be greatly simplified by using arrays and loops. Additionally, the code presented in the article duplicates the screening operation, which is unnecessary. This duplication has been removed by replacing the code with statements for decoding the value returned by MSOpenScreen (a number between 1 and 36). The decoding block takes the value returned from the MSOpenScreen function and extracts both the open and close zones.
4. Scorpio’s article in this issue includes the EasyLanguage
code for a key reversal trading strategy. This strategy is a modification
of the key reversal strategy that Scorpio included in his December 2001
article. The strategy allows the reader to implement one of the potential
statistical discoveries displayed by the statistical report generated by
MSOpenClosePct.
It appears that this has been generated with a legacy version
of TradeStation. To enable it to run on TradeStation 6, it needs a few
updates. The buy and sell statements must be updated. “Sell at H
Stop” has been changed to “SellShort next bar at H Stop.”
“Buy at lvl1 Stop” has been changed to “Buy next bar
at Lvl1 Stop.” If the code is being imported into TradeStation 6,
the changes will be made automatically. However, if you are cutting and
pasting, or typing the code, you will have to make the changes manually.
5. Several other minor simplifications and improvements were
made.
Function: MSOpenScreening
inputs:
 TME( numericsimple ) ;
variables:
 RefVolat( 0 ),
 Pr( 0 ) ;
arrays:
 LvlArray[5]( 0 ),
 CategoryArray[2]( 0 ) ;
RefVolat = AvgTrueRange( 10 ) ;
LvlArray[1] = High[ TME + 1 ]
 + RefVolat[ TME + 1 ] * .3 ;
LvlArray[2] = High[ TME + 1 ] ;
LvlArray[3] = ( High[ TME + 1 ] + Low[ TME + 1 ] ) / 2 ;
LvlArray[4] = Low[ TME + 1 ] ;
LvlArray[5] = Low[ TME + 1 ]
 - RefVolat[ TME + 1 ] * .3 ;
for Value1 = 1 to 2
        begin
    Pr = iff( Value1 = 1, Open, Close ) ;
    if Pr > LvlArray[1] then
         CategoryArray[Value1] = 1
    else if Pr > LvlArray[2] and Pr <= LvlArray[1] then
        CategoryArray[Value1] = 2
    else if Pr > LvlArray[3] and Pr <= LvlArray[2] then
        CategoryArray[Value1] = 3
 else if Pr > LvlArray[4] and Pr <= LvlArray[3] then
        CategoryArray[Value1] = 4
    else if Pr > LvlArray[5] and Pr <= LvlArray[4] then
        CategoryArray[Value1] = 5
    else if Pr <= LvlArray[5] then
        CategoryArray[Value1] = 6 ;
    end ;
MSOpenScreening =
    ( CategoryArray[1] - 1 ) * 6 + CategoryArray[2] ;
Function: KRPattern
inputs:
 TME( numericsimple ),
 PAT( numericsimple ) ;
{1-Key Reversal UP}
KRPattern = ( PAT = 1
 and Low[TME] < Low[ TME + 1 ]
 and Close[TME] > Close[ TME + 1 ]
 and Close[TME] < High[TME] ) ;
Indicator: MS Open-Close Pct
inputs:
 TME( numericsimple ),
 PAT( numericsimple ) ;
{1-Key Reversal UP}
KRPattern = ( PAT = 1
 and Low[TME] < Low[ TME + 1 ]
 and Close[TME] > Close[ TME + 1 ]
 and Close[TME] < High[TME] ) ;
This indicator and function code will be available for download from the EasyLanguage Exchange on www.tradestationworld.com. Look for the indicator called MS Open-Close Pct. A sample report is in Figure 1.
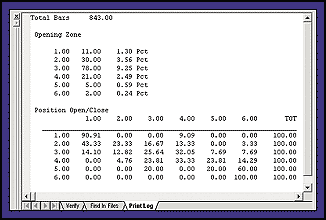
FIGURE 1: TRADESTATION, HOT ZONES. Here’s sample output from the revised indicator MS Open-Close PCT.
-- Mark Mills. EasyLanguage Specialist
TradeStation Technologies, Inc. (formerly Omega Research, Inc.)
A subsidiary of TradeStation Group, Inc.
www.TradeStation.com, www.TradeStationWorld.com
![]() METASTOCK: DEVELOPING HOT ZONES
METASTOCK: DEVELOPING HOT ZONES
This MetaStock formula is based on Massimiliano Scorpio’s “Developing Hot Zones” in this issue. To add this formula into MetaStock, click Tools | Expert Advisor. Then Click New and enter a name for the expert. Afterward, click the commentary tab and enter the code shown below. When finished, click OK.
To use the expert, open any chart and right-click any empty space. On the popup menu, select Expert Advisor | Attach. Select your expert and then click OK. Then right-click again and chose Expert Advisor | Commentary. You will probably need to resize the window so you can see all the text at once. The result will look similar to Figure 2 on the next page.
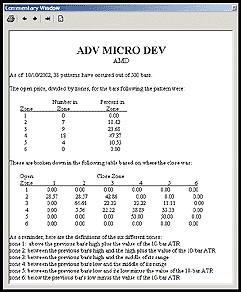
FIGURE 2: METASTOCK, HOT ZONES. Here’s a sample Expert Commentary in MetaStock.
The spacing of the numbers is controlled by the WriteVal() functions. The spacing on the headings were done by manually adding spaces in the text. You may need to edit the commentary a few times to get these headings to line up correctly. A line between the table headings and the table values can be made by underlining the heading row.
MetaStock Expert Advisor FORMULA
{pat is a variable defined as the pattern being analyzed.
 To analyze any other pattern, copy text of commentary into
 a word processor and search for
 pat:=
Replace the text following the equal sign with a formula defining the desired
pattern.Make sure there is a semicolon after the definition.}
<Name>
<Symbol>
As of <Date>, writeval(pat:= L<ref(l,-1) AND h>ref(h,-1);
 Cum(pat),0.0) patterns have occurred out of writeval(cum(1),0.0) bars.
The open price, divided by zones, for the bars following the pattern
were:
  Number in Percent in
 Zone Zone  Zone
    1  writeval(pat:= L<ref(l,-1) AND h>ref(h,-1);
 Cum(ref(pat,-1) AND o>=ref(h+atr(10),-1) ),25.0)  writeval(pat:=
L<ref(l,-1) AND h>ref(h,-1);
 n:=Cum(ref(pat,-1) AND o>=ref(h+atr(10),-1) ); (n/cum(pat))*100,35.2)
    2  writeval(pat:= L<ref(l,-1) AND h>ref(h,-1);
 Cum(ref(pat,-1) AND o<ref(h+atr(10),-1) AND o>=ref(h,-1) ),25.0)
writeval(pat:= L<ref(l,-1) AND h>ref(h,-1);
 n:=Cum(ref(pat,-1) AND o<ref(h+atr(10),-1) AND o>=ref(h,-1) );
(n/cum(pat))*100,35.2)
    3  writeval(pat:= L<ref(l,-1) AND h>ref(h,-1);
 Cum(ref(pat,-1) AND o<ref(h,-1) AND o>=ref(h-((h-l)/2),-1) ),25.0)
writeval(pat:= L<ref(l,-1) AND h>ref(h,-1);
 n:=Cum(ref(pat,-1) AND o<ref(h,-1) AND o>=ref(h-((h-l)/2),-1) );
(n/cum(pat))*100,35.2)
    4  writeval(pat:= L<ref(l,-1) AND h>ref(h,-1);
 Cum(ref(pat,-1) AND o<ref(h-((h-l)/2),-1) AND o>=ref(l,-1) ),25.0)
writeval(pat:= L<ref(l,-1) AND h>ref(h,-1);
 n:=Cum(ref(pat,-1) AND o<ref(h-((h-l)/2),-1) AND o>=ref(l,-1) );
(n/cum(pat))*100,35.2)
    5  writeval(pat:= L<ref(l,-1) AND h>ref(h,-1);
 Cum(ref(pat,-1) AND o<ref(l,-1) AND o>=ref(l-atr(10),-1) ),25.0)
writeval(pat:= L<ref(l,-1) AND h>ref(h,-1);
 n:=Cum(ref(pat,-1) AND o<ref(l,-1) AND o>=ref(l-atr(10),-1) );
(n/cum(pat))*100,35.2)
    6  writeval(pat:= L<ref(l,-1) AND h>ref(h,-1);
 Cum(ref(pat,-1) AND o<ref(l-atr(10),-1) ),25.0)   writeval(pat:=
L<ref(l,-1) AND h>ref(h,-1);
 n:=Cum(ref(pat,-1) AND o<ref(l-atr(10),-1) ); (n/cum(pat))*100,35.2)
 These are broken down in the following table based on where the close was:
 Open    Close Zone
 Zone 1  2   3  4 5 6
     1   {1}writeval(pat:= L<ref(l,-1) AND h>ref(h,-1);
 (Cum(ref(pat,-1) AND o>=ref(h+atr(10),-1) and c>=ref(h+atr(10),-1)
)/Cum(ref(pat,-1) AND o>=ref(h+atr(10),-1) )*100),15.2)   {2}writeval(pat:=
L<ref(l,-1) AND h>ref(h,-1);
 (Cum(ref(pat,-1) AND o>=ref(h+atr(10),-1) and c<ref(h+atr(10),-1) AND
c>=ref(h,-1) )/Cum(ref(pat,-1) AND o>=ref(h+atr(10),-1))*100 ),15.2)  {3}
writeval(pat:= L<ref(l,-1) AND h>ref(h,-1);
 (Cum(ref(pat,-1) AND o>=ref(h+atr(10),-1) and c<ref(h,-1) AND
c>=ref(h-((h-l)/2),-1) )/Cum(ref(pat,-1) AND o>=ref(h+atr(10),-1))*100
),15.2)  {4} writeval(pat:= L<ref(l,-1) AND h>ref(h,-1);
 (Cum(ref(pat,-1) AND o>=ref(h+atr(10),-1) and c<ref(h-((h-l)/2),-1) AND
c>=ref(l,-1) )/Cum(ref(pat,-1) AND o>=ref(h+atr(10),-1))*100 ),15.2)  {5}
writeval(pat:= L<ref(l,-1) AND h>ref(h,-1);
 (Cum(ref(pat,-1) AND o>=ref(h+atr(10),-1) and c<ref(l,-1) AND
c>=ref(l-atr(10),-1) )/Cum(ref(pat,-1) AND o>=ref(h+atr(10),-1))*100
),15.2)  {6} writeval(pat:= L<ref(l,-1) AND h>ref(h,-1);
 (Cum(ref(pat,-1) AND o>=ref(h+atr(10),-1) and c<ref(l-atr(10),-1)
)/Cum(ref(pat,-1) AND o>=ref(h+atr(10),-1))*100 ),15.2)
             2  {1} writeval(pat:= L<ref(l,-1) AND h>ref(h,-1);
 (Cum(ref(pat,-1) AND o<ref(h+atr(10),-1) AND o>=ref(h,-1) and
c>=ref(h+atr(10),-1) )/Cum(ref(pat,-1) AND o<ref(h+atr(10),-1) AND
o>=ref(h,-1))*100 ),15.2)  {2} writeval(pat:= L<ref(l,-1) AND h>ref(h,-1);
 (Cum(ref(pat,-1) AND o<ref(h+atr(10),-1) AND o>=ref(h,-1) and
c<ref(h+atr(10),-1) AND c>=ref(h,-1) )/Cum(ref(pat,-1) AND
o<ref(h+atr(10),-1) AND o>=ref(h,-1))*100 ),15.2)  {3} writeval(pat:=
L<ref(l,-1) AND h>ref(h,-1);
 (Cum(ref(pat,-1) AND o<ref(h+atr(10),-1) AND o>=ref(h,-1) and c<ref(h,-1)
AND c>=ref(h-((h-l)/2),-1) )/Cum(ref(pat,-1) AND o<ref(h+atr(10),-1) AND
o>=ref(h,-1))*100 ),15.2)  {4} writeval(pat:= L<ref(l,-1) AND h>ref(h,-1);
 (Cum(ref(pat,-1) AND o<ref(h+atr(10),-1) AND o>=ref(h,-1) and
c<ref(h-((h-l)/2),-1) AND c>=ref(l,-1) )/Cum(ref(pat,-1) AND
o<ref(h+atr(10),-1) AND o>=ref(h,-1))*100 ),15.2)  {5} writeval(pat:=
L<ref(l,-1) AND h>ref(h,-1);
 (Cum(ref(pat,-1) AND o<ref(h+atr(10),-1) AND o>=ref(h,-1) and c<ref(l,-1)
AND c>=ref(l-atr(10),-1) )/Cum(ref(pat,-1) AND o<ref(h+atr(10),-1) AND
o>=ref(h,-1))*100 ),15.2)  {6} writeval(pat:= L<ref(l,-1) AND h>ref(h,-1);
 (Cum(ref(pat,-1) AND o<ref(h+atr(10),-1) AND o>=ref(h,-1) and
c<ref(l-atr(10),-1) )/Cum(ref(pat,-1) AND o<ref(h+atr(10),-1) AND
o>=ref(h,-1))*100 ),15.2)
     3  {1} writeval(pat:= L<ref(l,-1) AND h>ref(h,-1);
 (Cum(ref(pat,-1) AND o<ref(h,-1) AND o>=ref(h-((h-l)/2),-1) and
c>=ref(h+atr(10),-1) )/Cum(ref(pat,-1) AND o<ref(h,-1) AND
o>=ref(h-((h-l)/2),-1))*100 ),15.2)  {2} writeval(pat:= L<ref(l,-1) AND
h>ref(h,-1);
 (Cum(ref(pat,-1) AND o<ref(h,-1) AND o>=ref(h-((h-l)/2),-1) and
c<ref(h+atr(10),-1) AND c>=ref(h,-1) )/Cum(ref(pat,-1) AND o<ref(h,-1) AND
o>=ref(h-((h-l)/2),-1))*100 ),15.2)  {3} writeval(pat:= L<ref(l,-1) AND
h>ref(h,-1);
 (Cum(ref(pat,-1) AND o<ref(h,-1) AND o>=ref(h-((h-l)/2),-1) and
c<ref(h,-1) AND c>=ref(h-((h-l)/2),-1) )/Cum(ref(pat,-1) AND o<ref(h,-1)
AND o>=ref(h-((h-l)/2),-1))*100 ),15.2)  {4} writeval(pat:= L<ref(l,-1) AND
h>ref(h,-1);
 (Cum(ref(pat,-1) AND o<ref(h,-1) AND o>=ref(h-((h-l)/2),-1) and
c<ref(h-((h-l)/2),-1) AND c>=ref(l,-1) )/Cum(ref(pat,-1) AND o<ref(h,-1)
AND o>=ref(h-((h-l)/2),-1))*100 ),15.2)  {5} writeval(pat:= L<ref(l,-1) AND
h>ref(h,-1);
 (Cum(ref(pat,-1) AND o<ref(h,-1) AND o>=ref(h-((h-l)/2),-1) and
c<ref(l,-1) AND c>=ref(l-atr(10),-1) )/Cum(ref(pat,-1) AND o<ref(h,-1) AND
o>=ref(h-((h-l)/2),-1))*100 ),15.2)  {6} writeval(pat:= L<ref(l,-1) AND
h>ref(h,-1);
 (Cum(ref(pat,-1) AND o<ref(h,-1) AND o>=ref(h-((h-l)/2),-1) and
c<ref(l-atr(10),-1) )/Cum(ref(pat,-1) AND o<ref(h,-1) AND
o>=ref(h-((h-l)/2),-1))*100 ),15.2)
     4  {1} writeval(pat:= L<ref(l,-1) AND h>ref(h,-1);
 (Cum(ref(pat,-1) AND o<ref(h-((h-l)/2),-1) AND o>=ref(l,-1) and
c>=ref(h+atr(10),-1) )/Cum(ref(pat,-1) AND o<ref(h-((h-l)/2),-1) AND
o>=ref(l,-1))*100 ),15.2)  {2} writeval(pat:= L<ref(l,-1) AND h>ref(h,-1);
 (Cum(ref(pat,-1) AND o<ref(h-((h-l)/2),-1) AND o>=ref(l,-1) and
c<ref(h+atr(10),-1) AND c>=ref(h,-1) )/Cum(ref(pat,-1) AND
o<ref(h-((h-l)/2),-1) AND o>=ref(l,-1))*100 ),15.2)  {3} writeval(pat:=
L<ref(l,-1) AND h>ref(h,-1);
 (Cum(ref(pat,-1) AND o<ref(h-((h-l)/2),-1) AND o>=ref(l,-1) and
c<ref(h,-1) AND c>=ref(h-((h-l)/2),-1) )/Cum(ref(pat,-1) AND
o<ref(h-((h-l)/2),-1) AND o>=ref(l,-1))*100 ),15.2)  {4} writeval(pat:=
L<ref(l,-1) AND h>ref(h,-1);
 (Cum(ref(pat,-1) AND o<ref(h-((h-l)/2),-1) AND o>=ref(l,-1) and
c<ref(h-((h-l)/2),-1) AND c>=ref(l,-1) )/Cum(ref(pat,-1) AND
o<ref(h-((h-l)/2),-1) AND o>=ref(l,-1))*100 ),15.2)  {5} writeval(pat:=
L<ref(l,-1) AND h>ref(h,-1);
 (Cum(ref(pat,-1) AND o<ref(h-((h-l)/2),-1) AND o>=ref(l,-1) and
c<ref(l,-1) AND c>=ref(l-atr(10),-1) )/Cum(ref(pat,-1) AND
o<ref(h-((h-l)/2),-1) AND o>=ref(l,-1))*100 ),15.2)  {6} writeval(pat:=
L<ref(l,-1) AND h>ref(h,-1);
 (Cum(ref(pat,-1) AND o<ref(h-((h-l)/2),-1) AND o>=ref(l,-1) and
c<ref(l-atr(10),-1) )/Cum(ref(pat,-1) AND o<ref(h-((h-l)/2),-1) AND
o>=ref(l,-1))*100 ),15.2)
     5  {1} writeval(pat:= L<ref(l,-1) AND h>ref(h,-1);
 (Cum(ref(pat,-1) AND o<ref(l,-1) AND o>=ref(l-atr(10),-1) and
c>=ref(h+atr(10),-1) )/Cum(ref(pat,-1) AND o<ref(l,-1) AND
o>=ref(l-atr(10),-1))*100 ),15.2)  {2} writeval(pat:= L<ref(l,-1) AND
h>ref(h,-1);
 (Cum(ref(pat,-1) AND o<ref(l,-1) AND o>=ref(l-atr(10),-1) and
c<ref(h+atr(10),-1) AND c>=ref(h,-1) )/Cum(ref(pat,-1) AND o<ref(l,-1) AND
o>=ref(l-atr(10),-1))*100 ),15.2)  {3} writeval(pat:= L<ref(l,-1) AND
h>ref(h,-1);
 (Cum(ref(pat,-1) AND o<ref(l,-1) AND o>=ref(l-atr(10),-1) and c<ref(h,-1)
AND c>=ref(h-((h-l)/2),-1) )/Cum(ref(pat,-1) AND o<ref(l,-1) AND
o>=ref(l-atr(10),-1))*100 ),15.2)  {4} writeval(pat:= L<ref(l,-1) AND
h>ref(h,-1);
 (Cum(ref(pat,-1) AND o<ref(l,-1) AND o>=ref(l-atr(10),-1) and
c<ref(h-((h-l)/2),-1) AND c>=ref(l,-1) )/Cum(ref(pat,-1) AND o<ref(l,-1)
AND o>=ref(l-atr(10),-1))*100 ),15.2)  {5} writeval(pat:= L<ref(l,-1) AND
h>ref(h,-1);
 (Cum(ref(pat,-1) AND o<ref(l,-1) AND o>=ref(l-atr(10),-1) and c<ref(l,-1)
AND c>=ref(l-atr(10),-1) )/Cum(ref(pat,-1) AND o<ref(l,-1) AND
o>=ref(l-atr(10),-1))*100 ),15.2)  {6} writeval(pat:= L<ref(l,-1) AND
h>ref(h,-1);
 (Cum(ref(pat,-1) AND o<ref(l,-1) AND o>=ref(l-atr(10),-1) and
c<ref(l-atr(10),-1) )/Cum(ref(pat,-1) AND o<ref(l,-1) AND
o>=ref(l-atr(10),-1))*100 ),15.2)
     6  {1} writeval(pat:= L<ref(l,-1) AND h>ref(h,-1);
 (Cum(ref(pat,-1) AND o<ref(l-atr(10),-1) and c>=ref(h+atr(10),-1)
)/Cum(ref(pat,-1) AND o<ref(l-atr(10),-1))*100 ),15.2)  {2} writeval(pat:=
L<ref(l,-1) AND h>ref(h,-1);
 (Cum(ref(pat,-1) AND o<ref(l-atr(10),-1) and c<ref(h+atr(10),-1) AND
c>=ref(h,-1) )/Cum(ref(pat,-1) AND o<ref(l-atr(10),-1))*100 ),15.2)  {3}
writeval(pat:= L<ref(l,-1) AND h>ref(h,-1);
 (Cum(ref(pat,-1) AND o<ref(l-atr(10),-1) and c<ref(h,-1) AND
c>=ref(h-((h-l)/2),-1) )/Cum(ref(pat,-1) AND o<ref(l-atr(10),-1))*100
),15.2)  {4} writeval(pat:= L<ref(l,-1) AND h>ref(h,-1);
 (Cum(ref(pat,-1) AND o<ref(l-atr(10),-1) and c<ref(h-((h-l)/2),-1) AND
c>=ref(l,-1) )/Cum(ref(pat,-1) AND o<ref(l-atr(10),-1))*100 ),15.2)  {5}
writeval(pat:= L<ref(l,-1) AND h>ref(h,-1);
 (Cum(ref(pat,-1) AND o<ref(l-atr(10),-1) and c<ref(l,-1) AND
c>=ref(l-atr(10),-1) )/Cum(ref(pat,-1) AND o<ref(l-atr(10),-1))*100
),15.2)  {6} writeval(pat:= L<ref(l,-1) AND h>ref(h,-1);
 (Cum(ref(pat,-1) AND o<ref(l-atr(10),-1) and c<ref(l-atr(10),-1)
)/Cum(ref(pat,-1) AND o<ref(l-atr(10),-1))*100 ),15.2)
As a reminder, here are the definitions of the six different zones:
Zone 1: above the previous bar’s high plus the value of
the 10-bar ATR
Zone 2: between the previous bar’s high and the high
plus the value of the 10-bar ATR
Zone 3: between the previous bar’s high and the middle
of its range
Zone 4: between the previous bar’s low and the middle
of its range
Zone 5: between the previous bar’s low and its low minus
the value of the 10-bar ATR zone 6: below the previous bar’s low
minus the value of the 10-bar ATR
--William Golson
Equis International
www.equis.com
![]() eSIGNAL: DEVELOPING HOT ZONES
eSIGNAL: DEVELOPING HOT ZONES
This eSignal formula is based on “Developing Hot Zones” by Massimiliano Scorpio in this issue. A sample chart can be seen in Figure 3.
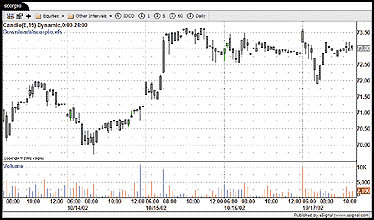
FIGURE 3: eSIGNAL, HOT ZONES. Here is a sample chart of hot zones in eSignal.
/*************************************************************************
Copyright © eSignal, a division of Interactive Data Corporation.
2002. All rights reserved. This sample eSignal Formula Script (EFS)
may be modified and saved under a new filename; however, eSignal is no
longer responsible for the functionality once modified. eSignal reserves
the right to modify and overwrite this EFS file with each new release.
************************************************************************/
var study = new ATRStudy(14);
function preMain() {
    setPriceStudy(true);
    setColorPriceBars(true);
    setDefaultPriceBarColor(Color.grey);
}
function main() {
 var lvl1 = 0;
 var RefVol = 0;
 RefVol = study.getValue(ATRStudy.ATR);
 if(RefVol == null)
  return;
 lvl1 = high() + RefVol * .3;
 if(low() < low(-1) && close() > close(-1)){
   if(open(1) > high() && open(1) < lvl1 && !Strategy.isShort())
   Strategy.doShort(“Short”, Strategy.LIMIT, Strategy.NEXTBAR, null, high());
   if(open(1) > high() && open(1) < lvl1 && !Strategy.isLong())
   Strategy.doLong(“Long”, Strategy.LIMIT, Strategy.NEXTBAR, null, lvl1);
 }
 Strategy.setStop(close(1));
 if(Strategy.isLong())
  setPriceBarColor(Color.lime);
 else if(Strategy.isShort())
  setPriceBarColor(Color.red);
 return;
}
/*
RefVol=AvgTrueRange(10);
lvl1=H[1]+RefVol[1]*0.30;
VAR:RefVol(0),LVL1(0);
RefVol=AvgTrueRange(10);
lvl1=H+RefVol*0.30;
IF L<L[1] AND C>C[1] THEN BEGIN
IF OPEN OF NEXT BAR >h and open of next bar<lvl1 then
sell at h stop;
IF OPEN OF NEXT BAR >h and open of next bar<lvl1 then
buy at lvl1 stop;
END;
SetExitOnClose
*/
--eSignal, a division of Interactive Data Corp.
800 815-8256, www.esignal.com
![]() WEALTH-LAB: DEVELOPING HOT ZONES
WEALTH-LAB: DEVELOPING HOT ZONES
Here is the Wealth-Lab code for Massimiliano Scorpio’s “Developing Hot Zones” in this issue. The following script makes use of the new custom indicator HotZones.
If you are running this script in Wealth-Lab Developer (as opposed to at the Wealth-Lab website), be sure to select Download ChartScripts from the menu to make sure you get this new indicator installed.
The script makes use of a two-dimensional array to compile the matrix of Open Zones x Close Zones. Using arrays allows us to substantially reduce the amount of code required to implement this strategy.
{$I ‘HotZone’}
var Bar, HotZonePane, zo, zc, Obs: integer;
var arZO: array[1..6] of integer;
var arMatrix: array[1..6] of array[1..6] of integer;
var s: string;
var x: float;
{ Plot Hot Zones for Open }
HotZonePane := CreatePane( 100, true, true );
PlotSeries( HotZoneSeries( #Open, 10 ), HotZonePane, 020, #ThickHist );
{ Gather data, populate matrix }
for Bar := 1 to BarCount - 2 do
begin
  if PriceLow( Bar ) < PriceLow( Bar - 1 ) then
    if PriceClose( Bar ) > PriceClose( Bar - 1 ) then
    begin
      SetBarColor( Bar, 070 );
      zo := Round( HotZone( Bar + 1, #Open, 10 ) );
      zc := Round( HotZone( Bar + 1, #Close, 10 ) );
      arZO[zo] := arZO[zo] + 1;
      arMatrix[zo][zc] := arMatrix[zo][zc] + 1;
      Obs := Obs + 1;
    end;
end;
{ Stop if no Key Reversal Days }
if Obs = 0 then
  Abort;
{ Print Results }
Print( ‘Opening Zone’ );
for zo := 1 to 6 do
begin
  s := IntToStr( zo ) + #9 + IntToStr( arZO[zo] ) + #9;
  x := arZO[zo] * 100 / Obs;
  s := s + FormatFloat( ‘#0.00%’, x );
  Print( s );
end;
Print( ‘’ );
Print( ‘Position Open/Close’ );
s := #9;
for zo := 1 to 6 do
  s := s + IntToStr( zo ) + #9;
s := s + ‘TOT’;
Print( s );
for zo := 1 to 6 do
begin
  Obs := arZO[zo];
  if Obs > 0 then
  begin
    s := IntToStr( zo ) + #9;
    for zc := 1 to 6 do
    begin
      x := arMatrix[zo][zc] * 100 / Obs;
      s := s + FormatFloat( ‘#0.00’, x ) + #9;
    end;
    s := s + ‘100.00’;
    Print( s );
  end;
end;
A sample chart is in Figure 4.
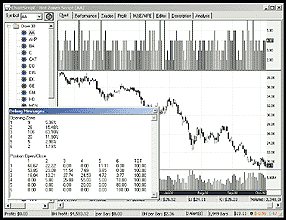
FIGURE 4: WEALTH-LAB, HOT ZONES. Here is a sample chart of hot zones in Wealth-Lab.
--Dion Kurczek, Wealth-Lab, Inc.
www.wealth-lab.com
![]() WEALTH-LAB: TESTING SIGNAL EFFICACY
WEALTH-LAB: TESTING SIGNAL EFFICACY
To build composites like the one described in Jeff Parent’s article in this issue, “Testing Signal Efficacy,” you can use the Index-Lab Add-On module for Wealth-Lab Developer 2.1.
In Index-Lab, you describe how the composite should be built using our WealthScript language. This offers maximum flexibility, and you can create simple composites (like the one described here) or more complex aggregate and breadth indicators.
Here is the Index-Lab script to create the composite based on the log of price change:
Result := LN( PriceClose( Bar ) / PriceClose( Bar - 1 ) );
Once the script is defined, you can configure Index-Lab to generate the composite on any of the symbol lists that you’ve set up in Wealth-Lab Developer. Index-Lab can update all of your composites daily after you update your data (Figure 5).
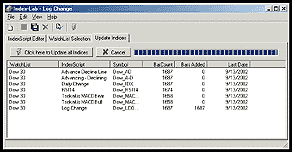
FIGURE 5: WEALTH-LAB, SIGNAL EFFICACY. Index-Lab can update all of your composites daily after you update your data.
You can plot the composite in Wealth-Lab Developer (Figure 6) by clicking on its symbol in the “Index-Lab” folder.
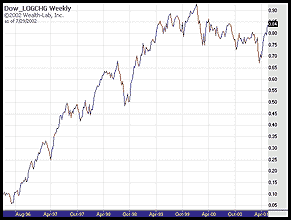
FIGURE 6: WEALTH-LAB, SIGNAL TESTING. Here is a sample chart of the composite in Wealth-Lab.
--Dion Kurczek, Wealth-Lab, Inc.
www.wealth-lab.com
![]() NEUROSHELL TRADER: DEVELOPING HOT ZONES
NEUROSHELL TRADER: DEVELOPING HOT ZONES
To determine the profit from Massimiliano Scorpio’s hot zone trading system in NeuroShell Trader, create the following indicators by selecting “New Indicator” from the Insert menu. A sample chart is in Figure 7.
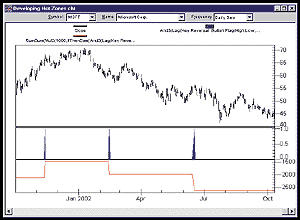
FIGURE 7: NEUROSHELL TRADER, HOT ZONES. Here’s a sample NeuroShell Trader chart demonstrating the hot zone system.
ENTRY PRICE:
Add2( High, Multiply(0.30, ATR(High,Low,Close,10) ) )
CONDITION1:
Lag (KeyReversal:Bullish Flag (High, Low, Close), 1)
CONDITION2:
A<B<C ( Lag(High,1), Open, Lag(ENTRY PRICE,1) )
CONDITION3:
A>=B ( High, Lag(ENTRYSTOP,1) )
ENTRY CONDITON:
And3 ( CONDITION1, CONDITION2, CONDITION3 )
EXIT PRICE:
IfThenElse ( A<B(Low,Lag(High,1), Lag(High,1), Close )
GAIN/LOSS:
IfThenElse ( ENTRY CONDITION,  Subtract ( EXIT PRICE, ENTRY PRICE ), 0 )
CUMULATIVE PROFIT:
Cumulative ( Multiply ( #Shares, GAIN/LOSS), 0 )
Users of NeuroShell Trader can go to the STOCKS & COMMODITIES section of the NeuroShell Trader free technical support website to download a sample chart with the hot zone trading indicators. The sample chart also includes the average true range (Atr) custom indicator used in the system.
--Marge Sherald, Ward Systems Group, Inc.
301 662-7950, sales@wardsystems.com
www.neuroshell.com
![]() NEUROSHELL TRADER: TESTING SIGNAL EFFICACY
NEUROSHELL TRADER: TESTING SIGNAL EFFICACY
In “Testing Signal Efficacy” in this issue, Jeff Parent discusses how to quantify the effectiveness of your trading signals. This technique can be easily implemented in NeuroShell Trader Professional by using NeuroShell Trader Professional’s ability to call external programs. These programs can be written in C, C++, Power Basic (also Visual Basic using one of our add-on packages), and Delphi.
We’ve created the minimum and maximum signal efficacy indicators that you can download from the NeuroShell Trader free technical support website.
After downloading the custom indicator, you can insert it by doing the following (Figure 8):
1. Select “New Indicator ...” from the Insert menu.
2. Select the Custom Indicator category.
3. Select the Min Signal Efficacy and Max Signal Efficacy indicators.
4. Select the parameters as you desire.
5. Select the Finished button.
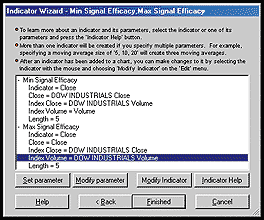
FIGURE 8: NEUROSHELL TRADER, SIGNAL EFFICACY. Here’s how to add the Min and Max signal efficacy indicators using NeuroShell Trader’s Indicator Wizard.
You can then export the indicators to Excel, as Parent suggests in the article, and also use Excel to create a histogram and analyze your indicator’s performance.
After downloading the custom indicator, you can easily analyze any of the built-in trading signal indicators (including candlesticks) or build your own by combining some of the 800+ built-in indicators.
After you find a good indicator, you can build a chart based on it by using that indicator in a prediction and/or trading strategy. In addition, if you decide to use your indicator in a prediction or a trading strategy, the coefficients can be optimized by the genetic algorithm built into NeuroShell Trader Professional. This can provide you with the parameters that maximize profitability.
Users of NeuroShell Trader can go to the STOCKS & COMMODITIES section of the NeuroShell Trader free technical support website to download a copy of any Traders’ Tip.
--Marge Sherald, Ward Systems Group, Inc.
301 662-7950, sales@wardsystems.com
https://www.neuroshell.com
![]() NEOTICKER: DEVELOPING HOT ZONES
NEOTICKER: DEVELOPING HOT ZONES
To implement in NeoTicker the concept presented by Massimiliano Scorpio in “Developing Hot Zones” in this issue, first create an indicator named MSOpenScreening with one integer parameter Tme (Listing 1). Then create the zone percentage counting indicator named MSOpenClosePct with no parameter (Listing 2).
The MSOpenClosePct generates a report of the zone statistical results to an opened report window (Figure 9).
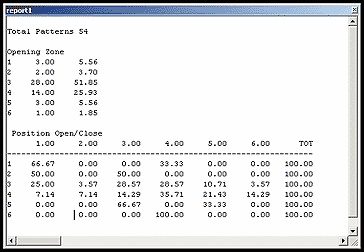
FIGURE 9: NEOTICKER, HOT ZONES. The MSOpenClosePct generates a report of the zone statistical results to an opened report window.
LISTING 1
function MSOpenScreening : double;
var lvl1, lvl2, lvl3, lvl4, lvl5 : double;
    RefVol : variant;
    TME : integer;
begin
   if not data1.Valid [0] then
   begin
     itself.success := false;
     exit;
   end;
   TME := param1.int;
   itself.makeindicator (‘myrefvol’, ‘avgtruerange’, [‘1’], [‘10’]);
   RefVol := itself.indicator (‘myrefvol’);
   lvl1 := Data1.High [TME+1] + RefVol.Value[TME+1]*0.3;
   lvl2 := Data1.High [TME+1];
   lvl3 := (Data1.High [TME+1]+ Data1.Low [TME+1])/2;
   lvl4 := Data1.Low [TME+1];
   lvl5 := Data1.Low [TME+1] - RefVol.Value [TME+1]*0.3;
   if Data1.Open [0] > lvl1 then
   begin
     if Data1.Close [0] > lvl1 then
        result := 1;
     if (Data1.Close [0] > lvl2) and (Data1.Close [0] <= lvl1) then
        result := 2;
     if (Data1.Close [0] > lvl3) and (Data1.Close [0] <= lvl2) then
        result := 3;
     if (Data1.Close [0] > lvl4) and (Data1.Close [0] <= lvl3) then
        result := 4;
     if (Data1.Close [0] > lvl5) and (Data1.Close [0] <= lvl4) then
        result := 5;
     if Data1.Close [0] <= lvl5 then
        result := 6;
   end;
   if (Data1.Open [0] > lvl2) and (Data1.Open [0] <= lvl1) then
   begin
     if Data1.Close [0] > lvl1 then
        result := 7;
     if (Data1.Close [0] > lvl2) and (Data1.Close [0] <= lvl1) then
        result := 8;
     if (Data1.Close [0] > lvl3) and (Data1.Close [0] <= lvl2) then
        result := 9;
     if (Data1.Close [0] > lvl4) and (Data1.Close [0] <= lvl3) then
        result := 10;
     if (Data1.Close [0] > lvl5) and (Data1.Close [0] <= lvl4) then
        result := 11;
     if Data1.Close [0] <= lvl5 then
        result := 12;
   end;
   if (Data1.Open [0] > lvl3) and (Data1.Open [0] <= lvl2) then
   begin
     if Data1.Close [0] > lvl1 then
        result := 13;
     if (Data1.Close [0] > lvl2) and (Data1.Close [0] <= lvl1) then
        result := 14;
     if (Data1.Close [0] > lvl3) and (Data1.Close [0] <= lvl2) then
        result := 15;
     if (Data1.Close [0] > lvl4) and (Data1.Close [0] <= lvl3) then
        result := 16;
     if (Data1.Close [0] > lvl5) and (Data1.Close [0] <= lvl4) then
        result := 17;
     if Data1.Close [0] <= lvl5 then
        result := 18;
   end;
   if (Data1.Open [0] > lvl4) and (Data1.Open [0] <= lvl3) then
   begin
     if Data1.Close [0] > lvl1 then
        result := 19;
     if (Data1.Close [0] > lvl2) and (Data1.Close [0] <= lvl1) then
        result := 20;
     if (Data1.Close [0] > lvl3) and (Data1.Close [0] <= lvl2) then
        result := 21;
     if (Data1.Close [0] > lvl4) and (Data1.Close [0] <= lvl3) then
        result := 22;
     if (Data1.Close [0] > lvl5) and (Data1.Close [0] <= lvl4) then
        result := 23;
     if Data1.Close [0] <= lvl5 then
        result := 24;
   end;
   if (Data1.Open [0] > lvl5) and (Data1.Open [0] <= lvl4) then
   begin
     if Data1.Close [0] > lvl1 then
        result := 25;
     if (Data1.Close [0] > lvl2) and (Data1.Close [0] <= lvl1) then
        result := 26;
     if (Data1.Close [0] > lvl3) and (Data1.Close [0] <= lvl2) then
        result := 27;
     if (Data1.Close [0] > lvl4) and (Data1.Close [0] <= lvl3) then
        result := 28;
     if (Data1.Close [0] > lvl5) and (Data1.Close [0] <= lvl4) then
        result := 29;
     if Data1.Close [0] <= lvl5 then
        result := 30;
   end;
   if Data1.Open [0] < lvl5 then
   begin
     if Data1.Close [0] > lvl1 then
        result := 31;
     if (Data1.Close [0] > lvl2) and (Data1.Close [0] <= lvl1) then
        result := 32;
     if (Data1.Close [0] > lvl3) and (Data1.Close [0] <= lvl2) then
        result := 33;
     if (Data1.Close [0] > lvl4) and (Data1.Close [0] <= lvl3) then
        result := 34;
     if (Data1.Close [0] > lvl5) and (Data1.Close [0] <= lvl4) then
        result := 35;
     if Data1.Close [0] <= lvl5 then
        result := 36;
   end;
end;
LISTING 2
function MSOpenClosePct : double;
const StoreSize = 43;
      Value1  = 0;
      Value2  = 1;
      Value3  = 2;
      Value4  = 3;
      Value5  = 4;
      Value6  = 5;
      Value7  = 6;
      Value8  = 7;
      Value9  = 8;
      Value10 = 9;
      Value11 = 10;
      Value12 = 11;
      Value13 = 12;
      Value14 = 13;
      Value15 = 14;
      Value16 = 15;
      Value17 = 16;
      Value18 = 17;
      Value19 = 18;
      Value20 = 19;
      Value21 = 20;
      Value22 = 21;
      Value23 = 22;
      Value24 = 23;
      Value25 = 24;
      Value26 = 25;
      Value27 = 26;
      Value28 = 27;
      Value29 = 28;
      Value30 = 29;
      Value31 = 30;
      Value32 = 31;
      Value33 = 32;
      Value34 = 33;
      Value35 = 34;
      Value36 = 35;
      Value37 = 36;
      Value38 = 37;
      Value39 = 38;
      Value40 = 39;
      Value41 = 40;
      Value42 = 41;
      Value99 = 42;
var RefVol, SCPattern0, SCPattern1, MyOpenScreening : variant;
    lvl1, lvl2, lvl3, lvl4, lvl5 : double;
    f1, f2, f3, f4, f5, f6, f7 : double;
    i : integer;
begin
   if Heap.Size = 0 then
   begin
     Heap.Allocate (StoreSize);
     Heap.Fill (0, StoreSize-1, 0);
   end;
   if not Data1.Valid [0] then
   begin
     ItSelf.Success := false;
     exit;
   end;
   ItSelf.MakeIndicator (‘myRefVol’, ‘avgtruerange’, [‘1’], [‘10’]);
   RefVol := ItSelf.Indicator (‘myRefVol’);
   ItSelf.MakeIndicator (‘KRP1’, ‘KRPattern’, [‘1’], [‘0’,’1']);
   SCPattern0 := ItSelf.Indicator (‘KRP1’);
   ItSelf.MakeIndicator (‘KRP2’, ‘KRPattern’, [‘1’], [‘1’,’1']);
   SCPattern1 := ItSelf.Indicator (‘KRP2’);
   ItSelf.MakeIndicator (‘MSOS’, ‘MSOpenScreening’, [‘1’], [‘0’]);
   MyOpenScreening := ItSelf.Indicator (‘MSOS’);
   lvl1 := Data1.High [1] + RefVol.value [1]*0.3;
   lvl2 := Data1.High [1];
   lvl3 := (Data1.High [1] + Data1.Low [1])/2;
   lvl4 := Data1.Low [1];
   lvl5 := Data1.Low [1] - RefVol.Value [1]*0.3;
   If SCPattern0.Value (0) = 1 then
      Heap.inc (Value99);
   If SCPattern1.Value (0) = 1 then
   begin
     if Data1.Open [0] > lvl1 then
     begin
       Heap.inc (Value1);
       if MyOpenScreening.Value [0] = 1 then
          Heap.inc (Value2);
       if MyOpenScreening.Value [0] = 2 then
          Heap.inc (Value3);
       if MyOpenScreening.Value [0] = 3 then
          Heap.inc (Value4);
       if MyOpenScreening.Value [0] = 4 then
          Heap.inc (Value5);
       if MyOpenScreening.Value [0] = 5 then
          Heap.inc (Value6);
       if MyOpenScreening.Value [0] = 6 then
          Heap.inc (Value7);
     end;
   end;
   If SCPattern1.Value (0) = 1 then
   begin
     If (Data1.Open [0] > lvl2) and (Data1.Open [0] <= lvl1) then
     begin
       Heap.inc (Value8);
       if MyOpenScreening.Value [0] = 7 then
          Heap.inc (Value9);
       if MyOpenScreening.Value [0] = 8 then
          Heap.inc (Value10);
       if MyOpenScreening.Value [0] = 9 then
          Heap.inc (Value11);
       if MyOpenScreening.Value [0] = 10 then
          Heap.inc (Value12);
       if MyOpenScreening.Value [0] = 11 then
          Heap.inc (Value13);
       if MyOpenScreening.Value [0] = 12 then
          Heap.inc (Value14);
     end;
   end;
   If SCPattern1.Value (0) = 1 then
   begin
     If (Data1.Open [0] > lvl3) and (Data1.Open [0] <= lvl2) then
     begin
       Heap.inc (Value15);
       if MyOpenScreening.Value [0] = 13 then
          Heap.inc (Value16);
       if MyOpenScreening.Value [0] = 14 then
          Heap.inc (Value17);
       if MyOpenScreening.Value [0] = 15 then
          Heap.inc (Value18);
       if MyOpenScreening.Value [0] = 16 then
          Heap.inc (Value19);
       if MyOpenScreening.Value [0] = 17 then
          Heap.inc (Value20);
       if MyOpenScreening.Value [0] = 18 then
          Heap.inc (Value21);
     end;
   end;
   If SCPattern1.Value (0) = 1 then
   begin
     If (Data1.Open [0] > lvl4) and (Data1.Open [0] <= lvl3) then
     begin
       Heap.inc (Value22);
       if MyOpenScreening.Value [0] = 19 then
          Heap.inc (Value23);
       if MyOpenScreening.Value [0] = 20 then
          Heap.inc (Value24);
       if MyOpenScreening.Value [0] = 21 then
          Heap.inc (Value25);
       if MyOpenScreening.Value [0] = 22 then
          Heap.inc (Value26);
       if MyOpenScreening.Value [0] = 23 then
          Heap.inc (Value27);
       if MyOpenScreening.Value [0] = 24 then
          Heap.inc (Value28);
     end;
   end;
   If SCPattern1.Value (0) = 1 then
   begin
     If (Data1.Open [0] > lvl5) and (Data1.Open [0] <= lvl4) then
     begin
       Heap.inc (Value29);
       if MyOpenScreening.Value [0] = 25 then
          Heap.inc (Value30);
       if MyOpenScreening.Value [0] = 26 then
          Heap.inc (Value31);
       if MyOpenScreening.Value [0] = 27 then
          Heap.inc (Value32);
       if MyOpenScreening.Value [0] = 28 then
          Heap.inc (Value33);
       if MyOpenScreening.Value [0] = 29 then
          Heap.inc (Value34);
       if MyOpenScreening.Value [0] = 30 then
          Heap.inc (Value35);
     end;
   end;
   If SCPattern1.Value (0) = 1 then
   begin
     If Data1.Open [0] <= lvl5 then
     begin
       Heap.inc (Value36);
       if MyOpenScreening.Value [0] = 31 then
          Heap.inc (Value37);
       if MyOpenScreening.Value [0] = 32 then
          Heap.inc (Value38);
       if MyOpenScreening.Value [0] = 33 then
          Heap.inc (Value39);
       if MyOpenScreening.Value [0] = 34 then
          Heap.inc (Value40);
       if MyOpenScreening.Value [0] = 35 then
          Heap.inc (Value41);
       if MyOpenScreening.Value [0] = 36 then
          Heap.inc (Value42);
     end;
   end;
   result := Heap.Value (Value99);
   if Data1.isLastbar then
   begin
     Report.Addline (‘’, ‘’);
     Report.Addline (‘’, ‘Total Patterns ‘ +
            tq_double2str(Heap.Value [Value99]));
     Report.Addline (‘’, ‘ ‘);
     Report.Addline (‘’, ‘Opening Zone ‘);
     f1 := Heap.Value [Value1]/Heap.Value [Value99]*100;
     Report.Addline (‘’, ‘1 ‘ +
                          tq_format(‘%8.2f %8.2f’, [Heap.Value [Value1], f1]));
     f1 := Heap.Value [Value8]/Heap.Value [Value99]*100;
     Report.Addline (‘’, ‘2 ‘ +
                          tq_format(‘%8.2f %8.2f’, [Heap.Value [Value8], f1]));
     f1 := Heap.Value [Value15]/Heap.Value [Value99]*100;
     Report.Addline (‘’, ‘3 ‘ +
                          tq_format(‘%8.2f %8.2f’, [Heap.Value [Value15], f1]));
     f1 := Heap.Value [Value22]/Heap.Value [Value99]*100;
     Report.Addline (‘’, ‘4 ‘ +
                          tq_format(‘%8.2f %8.2f’, [Heap.Value [Value22], f1]));
     f1 := Heap.Value [Value29]/Heap.Value [Value99]*100;
     Report.Addline (‘’, ‘5 ‘ +
                          tq_format(‘%8.2f %8.2f’, [Heap.Value [Value29], f1]));
     f1 := Heap.Value [Value36]/Heap.Value [Value99]*100;
     Report.Addline (‘’, ‘6 ‘ +
                          tq_format(‘%8.2f %8.2f’, [Heap.Value [Value36], f1]));
     Report.Addline (‘’, ‘ ‘);
     Report.Addline (‘’, ‘ Position Open/Close ‘);
     Report.Addline (‘’, ‘  ‘ +
            tq_format(‘%8s %8s %8s %8s %8s %8s %8s’,
                   [‘1.00’, ‘2.00’, ‘3.00’, ‘4.00’, ‘5.00’, ‘6.00’, ‘TOT’]));
     Report.Addline (‘’,
     ‘----------------------------------------------------’);
     if Heap.Value [Value1] > 0 then
     begin
       f1 := Heap.Value [Value2]/Heap.Value [Value1]*100;
       f2 := Heap.Value [Value3]/Heap.Value [Value1]*100;
       f3 := Heap.Value [Value4]/Heap.Value [Value1]*100;
       f4 := Heap.Value [Value5]/Heap.Value [Value1]*100;
       f5 := Heap.Value [Value6]/Heap.Value [Value1]*100;
       f6 := Heap.Value [Value7]/Heap.Value [Value1]*100;
       f7 := f1 + f2 + f3 + f4 + f5 + f6;
       Report.Addline (‘’, ‘1 ‘ +
              tq_format (‘%8.2f %8.2f %8.2f %8.2f %8.2f %8.2f %8.2f’,
                          [f1, f2, f3, f4, f5, f6, f7])) ;
     end;
     if Heap.Value [Value8] > 0 then
     begin
       f1 := Heap.Value [Value9]/Heap.Value [Value8]*100;
       f2 := Heap.Value [Value10]/Heap.Value [Value8]*100;
       f3 := Heap.Value [Value11]/Heap.Value [Value8]*100;
       f4 := Heap.Value [Value12]/Heap.Value [Value8]*100;
       f5 := Heap.Value [Value13]/Heap.Value [Value8]*100;
       f6 := Heap.Value [Value14]/Heap.Value [Value8]*100;
       f7 := f1 + f2 + f3 + f4 + f5 + f6;
       Report.Addline (‘’, ‘2 ‘ +
              tq_format (‘%8.2f %8.2f %8.2f %8.2f %8.2f %8.2f %8.2f’,
                          [f1, f2, f3, f4, f5, f6, f7])) ;
     end;
     if Heap.Value [Value15] > 0 then
     begin
       f1 := Heap.Value [Value16]/Heap.Value [Value15]*100;
       f2 := Heap.Value [Value17]/Heap.Value [Value15]*100;
       f3 := Heap.Value [Value18]/Heap.Value [Value15]*100;
       f4 := Heap.Value [Value19]/Heap.Value [Value15]*100;
       f5 := Heap.Value [Value20]/Heap.Value [Value15]*100;
       f6 := Heap.Value [Value21]/Heap.Value [Value15]*100;
       f7 := f1 + f2 + f3 + f4 + f5 + f6;
       Report.Addline (‘’, ‘3 ‘ +
              tq_format (‘%8.2f %8.2f %8.2f %8.2f %8.2f %8.2f %8.2f’,
                        [f1, f2, f3, f4, f5, f6, f7])) ;
     end;
     if Heap.Value [Value22] > 0 then
     begin
       f1 := Heap.Value [Value23]/Heap.Value [Value22]*100;
       f2 := Heap.Value [Value24]/Heap.Value [Value22]*100;
       f3 := Heap.Value [Value25]/Heap.Value [Value22]*100;
       f4 := Heap.Value [Value26]/Heap.Value [Value22]*100;
       f5 := Heap.Value [Value27]/Heap.Value [Value22]*100;
       f6 := Heap.Value [Value28]/Heap.Value [Value22]*100;
       f7 := f1 + f2 + f3 + f4 + f5 + f6;
       Report.Addline (‘’, ‘4 ‘ +
              tq_format (‘%8.2f %8.2f %8.2f %8.2f %8.2f %8.2f %8.2f’,
                        [f1, f2, f3, f4, f5, f6, f7])) ;
     end;
     if Heap.Value [Value29] > 0 then
     begin
       f1 := Heap.Value [Value30]/Heap.Value [Value29]*100;
       f2 := Heap.Value [Value31]/Heap.Value [Value29]*100;
       f3 := Heap.Value [Value32]/Heap.Value [Value29]*100;
       f4 := Heap.Value [Value33]/Heap.Value [Value29]*100;
       f5 := Heap.Value [Value34]/Heap.Value [Value29]*100;
       f6 := Heap.Value [Value35]/Heap.Value [Value29]*100;
       f7 := f1 + f2 + f3 + f4 + f5 + f6;
       Report.Addline (‘’, ‘5 ‘ +
              tq_format (‘%8.2f %8.2f %8.2f %8.2f %8.2f %8.2f %8.2f’,
                         [f1, f2, f3, f4, f5, f6, f7])) ;
     end;
     if Heap.Value [Value36] > 0 then
     begin
       f1 := Heap.Value [Value37]/Heap.Value [Value36]*100;
       f2 := Heap.Value [Value38]/Heap.Value [Value36]*100;
       f3 := Heap.Value [Value39]/Heap.Value [Value36]*100;
       f4 := Heap.Value [Value40]/Heap.Value [Value36]*100;
       f5 := Heap.Value [Value41]/Heap.Value [Value36]*100;
       f6 := Heap.Value [Value42]/Heap.Value [Value36]*100;
       f7 := f1 + f2 + f3 + f4 + f5 + f6;
       Report.Addline (‘’, ‘6 ‘ +
              tq_format (‘%8.2f %8.2f %8.2f %8.2f %8.2f %8.2f %8.2f’,
                        [f1, f2, f3, f4, f5, f6, f7])) ;
     end;
   end;
end;
A downloadable version of this indicator is available from the Yahoo! NeoTicker user group file area at https://groups.yahoo.com/group/neoticker/.
--Kenneth Yuen, TickQuest Inc.
www.tickquest.com
![]() NEOTICKER: TESTING SIGNAL EFFICACY
NEOTICKER: TESTING SIGNAL EFFICACY
In NeoTicker, to follow the steps of testing signal efficacy as presented in “Testing Signal Efficacy” by Jeff Parent, we utilize the power of the pattern scanner and programmable indicators.
Step 1: Use homogenous data
The NeoTicker pattern scanner can select a group of symbols and pipe
the resulting symbol list into a batch backtesting trading system and rank
the results. We start by setting up a pattern scanner to rank the result
of a trading system.
Open a new pattern scanner. Right-click on the pattern and select “Setup” from the popup menu to open the pattern scanner setup window.
Here are the setups to use for each tab:
Options
Ranking: Change the “Rank by” to Indicator.
Input: Select “Symbol List” as the input and, for this
example, use “200208 Dow Jones 30” (this is to show some
intermediate results)
Data
Time Frame: Type-Daily, Bar Size-1 and Days To Load-1000 (two years
of daily data)
Indicator
Enable-checked, On-checked, Rank-checked, C1->, Value1-0 (this means
we will only look at the stocks that produce profit)
Doubleclick on the Indicator field to open the Edit Indicator window.
Select indicator sys_hist_mov_avg_cross_over (this is the backtesting script
to be tested), from the “all” tab. Press Apply to confirm
selection.
This completes the settings. Press Apply and Start Scan, and the scan will produce a list of stocks that are profitable using the moving average cross over system.
The second part we will produce a group of stocks that fulfill a certain criteria. This example finds stocks from the Nasdaq 100 that are trading above $20 with at least 100,000 shares a day.
Open another new pattern scanner window. Right-click and open the setup window.
Here are the setups to use for each tab:
Options
Ranking: Change the “Rank by” to Indicator
Symbol List: Select the Symbol List as your input, such as “200208
Nasdaq 100”
Output: Check on the Symbol List and name it “price vol result.”
(This symbol list is for the calculation of the composite.)
Chain Scan: Select the batch testing scan as the next scan.
Data
Time Frame: Type-Daily, Bar Size-1, Days To Load 1000.
Indicator
Enable Indicators-checked, On-checked, Rank-checked, C1->, Value-100,000
Doubleclick on the Indicator field and the Edit Indicator window will
open. Click on the “all” tab, and select the formula from
the indicator selection. At the Plot1 field, click the “...”
on the side of the field to open an Editor Formula window. Click on the
Indicator Wizard on the lower left-hand corner. Select “simple moving
average” from the “all” tab, and click on the OK button
to construct the formula. You will see a formula “average (0, data1,
10)” in the Edit Formula window; change it to “average(0,
vol(data1),
10)” to scan for the volume. Now click on the OK button
on the lower right-hand corner to complete the formula setup. Click on
the Apply button to save the formula setting.
Current
Check the checkbox beside “Last Price.” Change the “Min”
field to 20.00.
Press Apply and Start Scan. This scan will produce a list of stocks that are trading above $20 with an average volume greater than 100,000 shares.
If you have both scanning windows open, you will see the results in the batch testing scan from the price volume scan show up after both scans are completed.
This is how to utilize the NeoTicker scanner to batch test and filter stocks.
Step 2: Compile a composite
NeoTicker can easily construct and chart a custom composite using (Figure
10) NeoTicker native scripting languages.
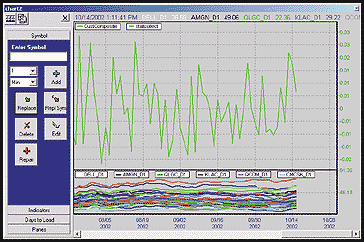
FIGURE 10: NEOTICKER, SIGNAL TESTING. Here’s a sample NeoTicker chart showing the composite indicator in NeoTicker.
The composite indicator discussed in the article is the average
daily price change of each stock. In this example, we use the Dow Jones
30 as the basket of stocks. Create an indicator named CustComposite with
no parameter (Listing 1).
LISTING 1
function CustComposite : double;
var NumOfSymbols, i : integer;
var DailyDiff, MyComposite : double;
begin
   NumOfSymbols := DataSeries.Count;
   myComposite := 0;
   for i := 1 to NumOfSymbols do
   begin
     if DataSeries.items [i].valid [0] then
     begin
        DailyDiff := tq_log10(DataSeries.items [i].Value [0]/
                              DataSeries.items [i].value [1]);
        MyComposite := DailyDiff + MyComposite;
     end;
   end;
   if NumOfSymbols <> 0 then
      result := MyComposite/NumOfSymbols
   else
      itself.success := false;
end;
To calculate the composite of the result from the scan, save the scan result into a symbol list. Add the “price vol result” list into a chart by using the Chart Manager Add List button and run the CustComposite indicator in that chart.
Step 3: Random selection vs. selection by indicator
NeoTicker can calculate and return the difference between the highest
and the lowest of the group of stocks generated by the signal, and we will
write the results to a report window. This format allows you to import
the result into Excel for further statistical analysis. For this, we need
to create an indicator StatCollect (Listing 2).
LISTING 2
function statcollect : double;
const StoreSize = 5;
var custidx : variant;
    NumOfStocks, i : integer;
    rng : array [1..5] of double;
    MinVal, MaxVal : double;
begin
   if Heap.Size = 0 then
   begin
     Heap.Allocate (StoreSize);
     Heap.Fill (0, StoreSize-1, 0);
   end;
   NumOfStocks := DataSeries.Count;
   ItSelf.MakeIndicator (‘custidx’, ‘CustComposite’, [‘1’], [‘’]);
   custidx := ItSelf.Indicator (‘custidx’);
   if custidx.Valid [0] then
      result := custidx.Value [0]
   else
      itself.success := false;
   rng[1] := custidx.Value [4] - custidx.Value [5];
   rng[2] := custidx.Value [3] - custidx.Value [5];
   rng[3] := custidx.Value [2] - custidx.Value [5];
   rng[4] := custidx.Value [1] - custidx.Value [5];
   rng[5] := custidx.Value [0] - custidx.Value [5];
   Report.Addline (‘’, ‘ Highest  Lowest’);
   for i := 1 to NumOfStocks do
   begin
     if DataSeries.Items [i].Valid [5] and DataSeries.Items [i].Valid [4] and
        DataSeries.Items [i].Valid [3] and DataSeries.Items [i].Valid [2] and
        DataSeries.Items [i].Valid [1] and DataSeries.Items [i].Valid [0] then
     begin
       Heap.value [0] := tq_log10(DataSeries.Items [i].Value [4]/
                                  DataSeries.Items [i].Value [5])-rng[1];
       Heap.value [1] := tq_log10(DataSeries.Items [i].Value [3]/
                                  DataSeries.Items [i].Value [5])-rng[2];
       Heap.value [2] := tq_log10(DataSeries.Items [i].Value [2]/
                                  DataSeries.Items [i].Value [5])-rng[3];
       Heap.value [3] := tq_log10(DataSeries.Items [i].Value [1]/
                                  DataSeries.Items [i].Value [5])-rng[4];
       Heap.value [4] := tq_log10(DataSeries.Items [i].Value [0]/
                                  DataSeries.Items [i].Value [5])-rng[5];
       MaxVal := Heap.Max (0, StoreSize-1);
       MinVal := Heap.Min (0, StoreSize-1);
       Report.Addline (‘’, tq_format(‘ %8.2f %8.2f’, [MaxVal, MinVal]));
     end;
   end;
end;
The StatCollect indicator will plot the custom composite and
report the statistical results to an opened report window (Figure 11).
Downloadable versions of these indicators will be available at
the NeoTicker Yahoo! user group as well as the TickQuest website.
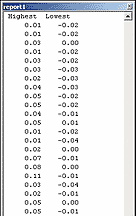
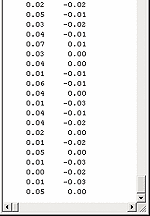
FIGURE 11: NEOTICKER, SIGNAL TESTING. The StatCollect indicator will plot the custom composite and report the statistical results to an opened report window.
--Kenneth Yuen, TickQuest Inc.GO BACK
www.tickquest.com
![]() INVESTOR/RT: DEVELOPING HOT ZONES
INVESTOR/RT: DEVELOPING HOT ZONES
In “Developing Hot Zones” in this issue, Massimiliano Scorpio demonstrates a technique for forecasting a bar’s close from its open.
The chart in Figure 12 was constructed using several custom indicators
in Investor/RT to plot the hot zones. The following custom indicator syntax
is used to represent each of the five points that separate the six zones.
Point 1:  HI + 0.30 * TR
Point 2:  HI
Point 3:  (HI + LO)/2
Point 4:  LO
Point 5: LO ? 0.30 * TR
The TR (true range) token is set up with a 10-period simple smoothing to provide an average true range. The gray regions above and below the bar represent zones 1 and 6, respectively, for each bar. Zone 2 is represented in blue, zone 3 in green, zone 4 in red, and zone 5 in yellow.
The lower pane of Figure 12 shows zones in which the open and close landed for each bar. The green histogram shows which zone the bar closed in, while the blue histogram shows which zone the bar opened in. These histograms were created using custom indicators. The custom indicator for the blue (open) histogram is created in Investor/RT using the following syntax:
(OP > HI.1 + TR.1 * 0.30) * 1 +
(OP <= HI.1 + TR.1 * 0.30 AND OP > HI.1) * 2 +
(OP <= HI.1 AND OP > (HI.1 + LO.1)/2) * 3 +
(OP <= (HI.1 + LO.1)/2 AND OP > LO.1) * 4 +
(OP <= LO.1 AND OP > LO.1 - 0.30 * TR.1) * 5 +
(OP < LO.1 - 0.30 * TR.1) * 6
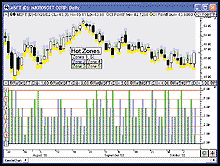
FIGURE 12: INVESTOR/RT, HOT ZONES. Here’s a daily candlestick chart of MSFT overlaying the hot zones. The lower chart pane shows the zone in which the bar opened (blue) and closed (green).
--Chad Payne, Linn Software
800-546-6842, info@linnsoft.com
www.linnsoft.com
![]() INVESTOR/RT: TESTING SIGNAL EFFICACY
INVESTOR/RT: TESTING SIGNAL EFFICACY
In “Testing Signal Efficacy” in this issue, Jeff Parent presents a technique for quantifying the effectiveness of trading signals.
The Investor/RT chart in Figure 13 was constructed using several signal markers and the Signal Statistics indicator in Investor/RT to help measure signal efficiency. The orange arrows overlaying the candlestick chart are signal markers that are based on a signal called market structure low (Msl). The Msl signal has the following syntax:
CL > OP AND LO > LO.1 AND LO.1 < LO.2 AND LO.2 < LO.3
This signal looks for a candle in which the price closes above the open with a higher low than the previous candle, following two candles with lower lows. This chart can be constructed using any signal. Msl is just being used as an example.
The lower window pane in Figure 13 contains two Signal Statistics indicators. The green histogram represents the five-period maximum favorable excursion (MFE) while the red histogram represents the five-period maximum adverse excursion (Mae). Mfe represents the maximum gain achievable over the five-bar period following the signal (MSL). Mae represents the maximum loss achievable over the five-bar period following the signal. Mfe gives you the best possible output while Mae gives you the worst possible output, assuming you hold the position no longer than five bars. The period is adjustable within the Signal Statistics indicator.
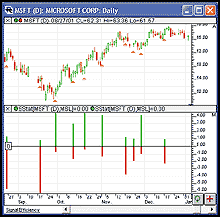
FIGURE 13: INVESTOR/RT, SIGNAL TESTING. Here’s a daily candlestick chart of MSFT overlaid with signal markers representing the market structure low (MSL) signal. The lower chart pane contains two signal statistic indicators representing the five-period maximum favorable excursion and maximum adverse excursion of the MSL signal.
Investor/RT’s Signal Statistics indicator is a flexible indicator that has become very popular with Investor/RT users in recent months. It allows the user to take any signal and compute a variety of statistics on that indicator.
The preference window for the Signal Statistics indicator can be seen in Figure 14.
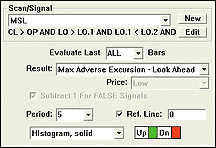
FIGURE 14: INVESTOR/RT, SIGNAL STATISTICS INDICATOR PREFERENCES. Here are the settings used for the Signal Statistics indicator seen in Figure 13.
This shows the preferences used to draw the green histogram representing
the five-period MFE of the MSL signal. The phrase “Look ahead”
means that the signal looks ahead over the period specified to determine
the maximum potential gain. Signal Statistics currently provides 23 statistics
options from which to choose, including:
- Sum of Consecutive Signals
- Sum of All Signals
- Bars Since Last Signal
- Running Total
- Frequency Over Recent Period
- Percent Of Recent Period
- Percent Of All Bars
- Price At Last Signal
- Change Since Last Signal
- Sum Of Session Signals (Intraday)
- Profit/Loss ? Look Ahead
- Highest Price Since Signal
- Lowest Price Since Signal
- Price Before/After Last Signal
- Short Profit/Loss ? Look Ahead
- Maximum Profit Since Signal
- Maximum Loss Since Signal
- Max Favorable Excursion ? Look Ahead
- Max Adverse Excursion ? Look Ahead
- MFE Period (Bars to MFE)
- MAE Period (Bars to MAE)
- Bars From Signal To Highest Price
- Bars From Signal To Lowest Price
Signal Statistics can be used as a standalone indicator or can be used in the RTL language using the token Sstat to create custom indicators, scans, or signals. For more information on Signal Statistics and the result options available, visit https://www.linnsoft.com/tour/techind/sstat.htm.
--Chad Payne, Linn SoftwareGO BACK
800-546-6842, info@linnsoft.com
www.linnsoft.com
![]() TECHNIFILTER PLUS: HOT ZONES
TECHNIFILTER PLUS: HOT ZONES
Here are a TechniFilter Plus formula and report that allow you to check out the idea presented by Massimiliano Scorpio in “Developing Hot Zones.”
The “Zone Formula” given here returns the zone number of the parameter passed into the formula. The “Zone Report” allows you to enter a particular signal in column 2, and then see the frequency of where the open price is with respect to Scorpio’s hot zones on the day after the signal.
Zone Formula
NAME: Zone
SWITCHES: multiline
PARAMETERS: C
FORMULA:
[1]: .3 * ((H%CY1)-(L#CY1))X19 {30%ATR}
[2]: H + [1] {point 1}
[3]: H {point 2}
[4]: (H+L) / 2 {point 3}
[5]: L  {point 4}
[6]: L - [1] {point 5}
[7]: (&1 > [2])
 + 2 * (&1 <= [2]) * (&1 > [3])
 + 3 * (&1 <= [3]) * (&1 > [4])
 + 4 * (&1 <= [4]) * (&1 > [5])
 + 5 * (&1 <= [5]) * (&1 > [6])
 + 6 * (&1 <= [6])
Zone Report with columns 4-9 listing zone frequencies
NAME: ZoneTest
FORMULAS----------------------------------
  [1] Symbol
  [2] Signal
       ((C>CA20) * (CY1<CA20Y1))Y1
  [3] Zone
       Zone(O)
  [4] Zone1Count
       ([2] * ([3]=1))F0
  [5] Zone2Count
       ([2] * ([3]=2))F0
  [6] Zone3Count
       ([2] * ([3]=3))F0
  [7] Zone4Count
       ([2] * ([3]=4))F0
  [8] Zone5Count
       ([2] * ([3]=5))F0
  [9] Zone6Count
       ([2] * ([3]=6))F0
Visit RTR’s website to download this formula as well as program updates.
--Clay Burch, Rtr Software
919 510-0608, rtrsoft@aol.com
www.rtrsoftware.com
All rights reserved. © Copyright 2002, Technical Analysis, Inc.
Return to December 2002 Contents